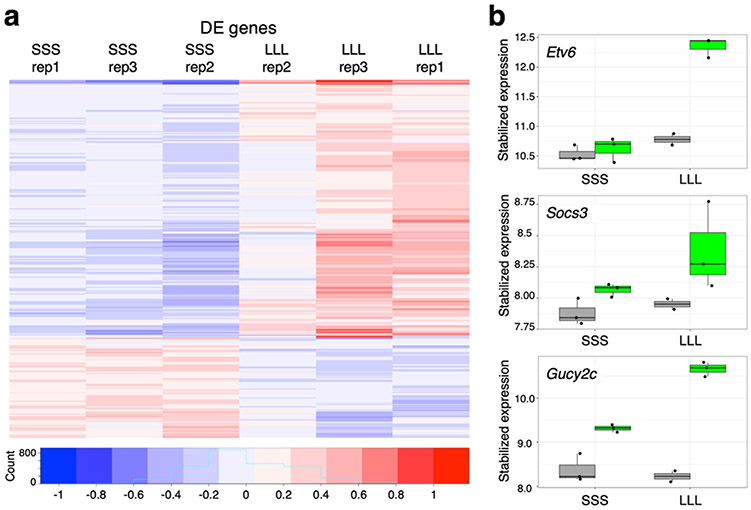
Fig. 3.
Leptin-responsive transcriptome. a A heatmap of mean subtracted, log stabilized read counts showing differentially expressed genes for fasted mice treated either with saline (SSS) or with leptin at 12, 24 and 34 hours (LLL). b Boxplots showing the expression levels of Etv6, Socs3 and Gucy2c in LepRb GFP-positive (green) or negative (grey) nuclei within the two conditions. The y-axis shows stabilized expression which is log2 scale for sequencing depth normalized counts determined by DESeq239. Box plots represent 25th to 75th percentiles and the midline indicates the median. n=3 biologically independent replicates.

