Fig. 4.
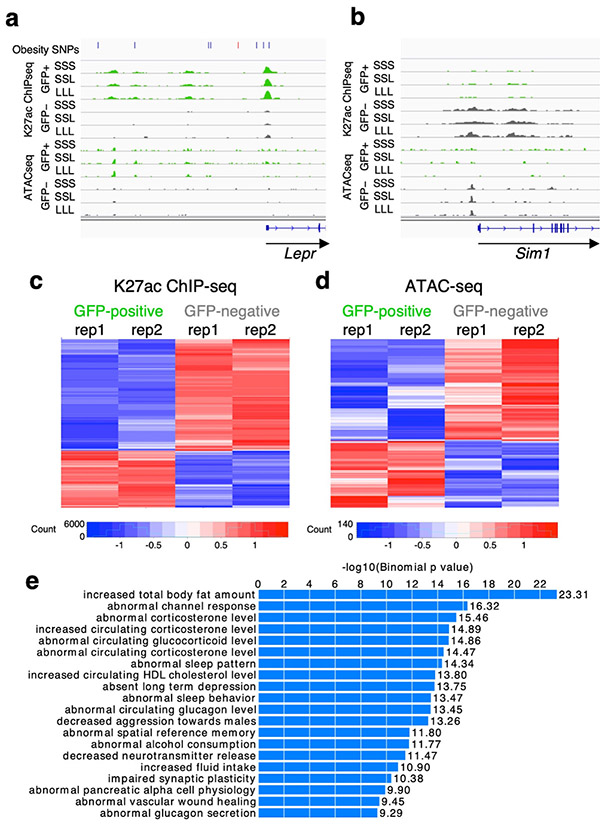
LepRb-GFP positive regulome. a-b Genomic snapshots of Lepr (a) and Sim1 (b) loci showing enrichment of H3K27ac ChIP-seq and ATAC-seq signals around Lepr in Leptin-responsive neurons (green) compared to GFP-negative nuclei (grey) and the opposite for Sim1. Leptin conditions include mice treated with saline (SSS) or leptin (LLL) injections at 12, 24 and 34 hours (LLL) or saline injections at 12 and 24 hours followed by a single leptin injection at 34 hours (SSL). The obesity SNPs track for Lepr shows obesity-associated SNPs33, including SNPs that are in linkage disequilibrium (r2>0.8) with the lead SNP rs11804091 (red line). Each of the two replicates for ChIP-seq and ATAC-seq presented comparable signals as shown. c-d Heatmaps showing differential ChIP-seq (c) and ATAC-seq (d) peaks between leptin-responsive and GFP negative nuclei. Two replicates are shown for each condition. e GREAT analysis27 for H3K27ac ChIP-seq peaks that are enriched in LepRb GFP-positive nuclei (n=7,726; p-values obtained by binomial enrichment test).

