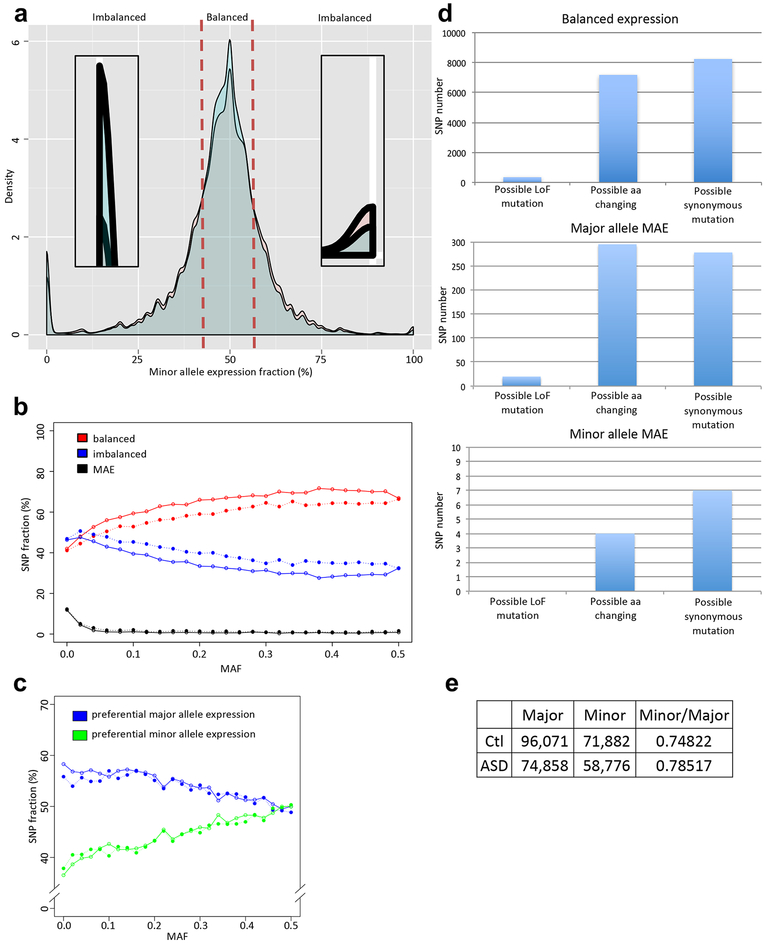
Figure 4.
Quantitative allelic imbalance in idiopathic ASD and control cortex. (a) The distribution of minor allele expression fraction for idiopathic ASD (red) and control (blue) groups for autosomal SNPs. The majority of loci show balanced expression. The density plot near 0% and 100% are zoomed in to show patterns of monoallelic expression. (b) SNP fractions of balanced, imbalanced, or MAE expression per MAF. (c) SNP fractions showing preferential major or minor allele expression per MAF. At (b) and (c), open circles are for control, and close circles are for idiopathic ASD. (d) The comparison of SNP numbers, which possibly can cause LoF mutation, amino acid change, or synonymous mutation at control cortex. Major allele MAE has a role to prevent deleterious LoF and missense mutations. Y-axes show SNP numbers. (e) SNP counts showing preferential expression of the major and minor alleles in control and idiopathic ASD. Their ratio is expressed as the Minor/Major.

