Figure 7.
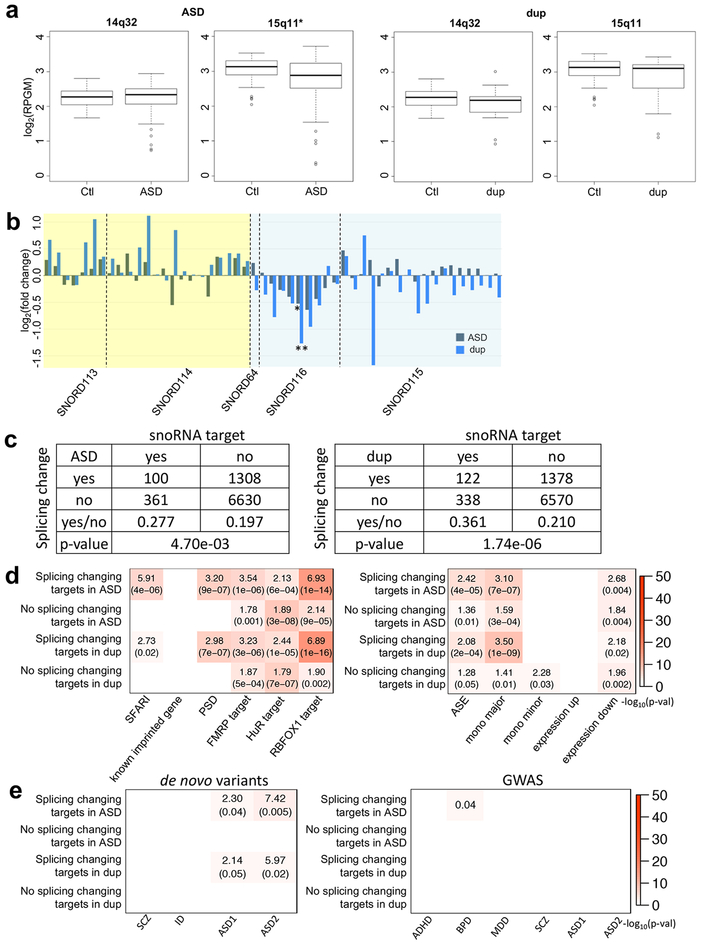
The characterization of the allele shift rich regions in ASD and dup15q. (a) Regional expression changes of the common allele shift rich regions in ASD and dup15q. The X axes are log2(reads per kilobase of gene model per million mapped reads) (log2(RPGM)), and two tailed unpaired t-test p-values are 0.6397, 0.0016, 0.1538, and 0.1525 for 14q32 in ASD, 15q11 in ASD, 14q32 in dup15q, and 15q11 in dup15q, respectively. Significantly down-regulated regions are marked with an asterisk. 14q32 in ASD also has less mean than control like the others. The minimum, 1st quantile, median, 3rd quantile, and maximum values of the boxplots show at 14q32 (control: 1.671, 2.048, 2.270, 2.442, and 2.806; ASD: 0.7351, 2.0643, 2.3355, 2.5048, and 2.9375; dup15q: 0.9286, 1.8464, 2.1859, 2.2984, and 3.0108, respectively) and 15q11 (control: 2.039, 2.890, 3.130, 3.302, and 3.524; ASD: 0.3255, 2.5385, 2.8784, 3.2264, and 3.7170; dup15q: 1.114, 2.537, 3.105, 3.208, and 3.430, respectively). (b) snoRNA gene expression changes in ASD and dup15q. Yellow and blue backgrounds indicated 14q32 and 15q11, respectively. Among snoRNA genes, 51 genes (RPKM≧1) are selected. From linear mixed model based differential expression gene study, significantly down-regulated SNORD116–24 genes (ASD: p-value=0.0347; dup15q: p-value=0.0019) are marked with asterisks (*: p-value≦0.05; **: p-value≦0.001). (c) The number of snoRNA target genes and genes with splicing changes in ASD and dup15q. Two-sided Fisher’s exact test p-values were shown at the bottom of tables. (d) Gene set enrichment analysis for snoRNA target genes. Among snoRNA target genes, we compared splicing change and the other genes in ASD and dup15q brain. The labels “mono major” and “mono minor” are major and minor allele MAE genes, respectively. The labels “expression up” and “expression down” represent significantly up- and down-regulated genes in idiopathic ASD4. (e) Gene set enrichment study of snoRNA target genes with risk variants in psychiatric diseases. For de novo variant datasets45,33, SCZ, ID, and ASD1 gene lists were de novo likely gene disrupting mutations45, and ASD2 represents ASD risk genes integrating de novo copy number variations (FDR≦0.01)33 (Methods). Plot showed ORs and the p-values if significant. The GWAS datasets were considered for ADHD34, BPD34, MDD34, SCZ34, and ASD34,35. Here, among ASD GWAS datasets, ASD1 and ASD2 represent the Cross-Disorder Group of the Psychiatric Genomics34 and Grove et al.35, respectively. If significant, the plots show FDR corrected p-values for GWAS (Methods). Dup is dup15q patients. For (a), (b), (d), and (e), RNA-seq sample numbers of control, ASD, and dup15q are 69, 62, and 15, respectively.

