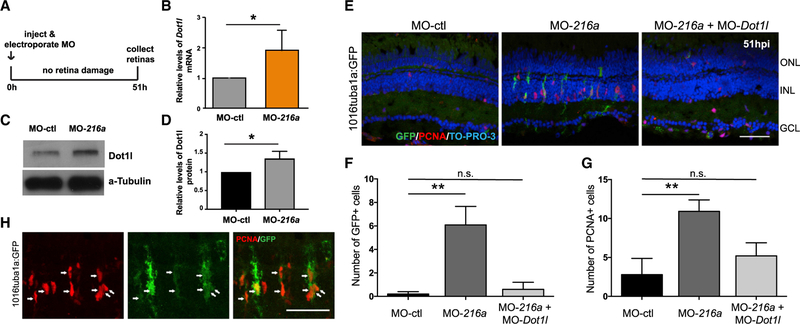
Figure 5. miR-216a Suppression Stimulates MG Dedifferentiation and Proliferation in the Uninjured Retina through Regulating Dot1l.
(A) Undamaged Tg(1016tuba1a:gfp) zebrafish were injected and electroporated with control MOs (n = 5), miR-216a MOs (n = 6), or both (n = 5). Either eyes for immunostaining or retinas for expression analysis were collected at 51 h post-injection (hpi).
(B) Fold changes in dot1l levels in MO-ctl or MO-216a electroporated retinas were quantified by qPCR. At 51 hpi, dot1l was significantly upregulated in miR-216a overexpressing retinas ~2-fold. Data represent means ± SEMs; *p < 0.05 using Student’s t test, p = 0.0365.
(C) Representative western blot for Dot1l and a-tubulin in control and miR-216a MO-injected retinas at 51 hpi.
(D) Quantification for the relative levels of Dot1l protein in miR-216a MO-injected retinas compared to controls. Data represent means ± SEMs from 3 independent experiments, *p < 0.05 using Student’s t test.
(E) miR-216a MOs significantly increased the number of PCNA+ and GFP+ cells in the INL, while there was no significant difference between miR-216a MO+ dot1l MO co-injected eyes and control eyes.
(F and G) Quantification of GFP+ dedifferentiated MG (F) and PCNA+ proliferating progenitors (G) in MO-ctl, MO-216a, and MO-216a + MO-dot1l electroporated retinas. Data represent means ± SEMs (n = 6 fish). **p < 0.01, PCNA p = 0.0098, and GFP p = 0.0039 by 1-way ANOVA with Dunnett’s multiple comparisons test.
(H) Representative retinal sections showing colocalization of tuba1a-GFP+ and PCNA+ cells in miR-216 MO injected undamaged retinas at 51 hpi.
GCL, ganglion cell layer; INL, inner nuclear layer; ONL, outer nuclear layer.
Scale bar, 50 µm.

