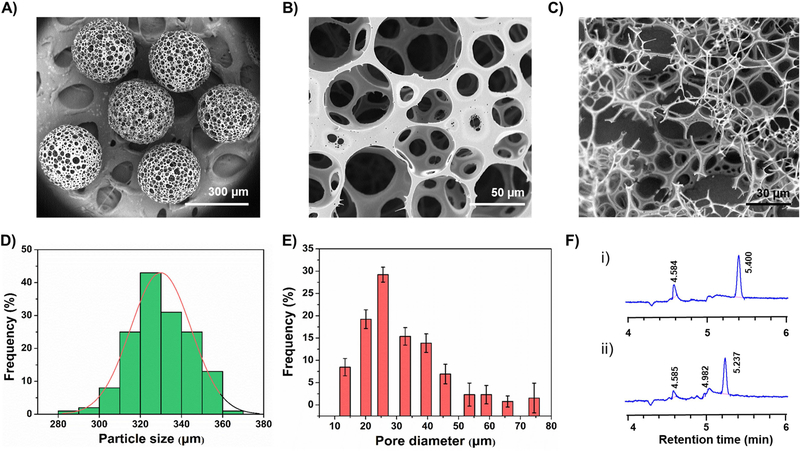
Figure 3. Physical characterization of PLGA HOPMs.
A-C) SEM images showing A) size distribution of PLGA HOPMs, B) surface morphology of a microcarrier, and C) cross-sectional view displaying the interior of a microcarrier. D-E) Frequency analyses illustrating D) the particle size distribution (average pore size: 320 μm) as well as E) the pore diameter distribution (distributed in the range of 10–80 μm) of fabricated PLGA HOPMs (obtained at the optimal conditions based on run-9 of Table 1), based on the SEM image (Figure B) analysis (n=200). F) Gas chromatographic analysis showing the organic solvent (DCM) residue in the PLGA HOPMs at a retention time (tR) of 5.4 min for (i) DCM and (ii) PLGA HOPMs.

