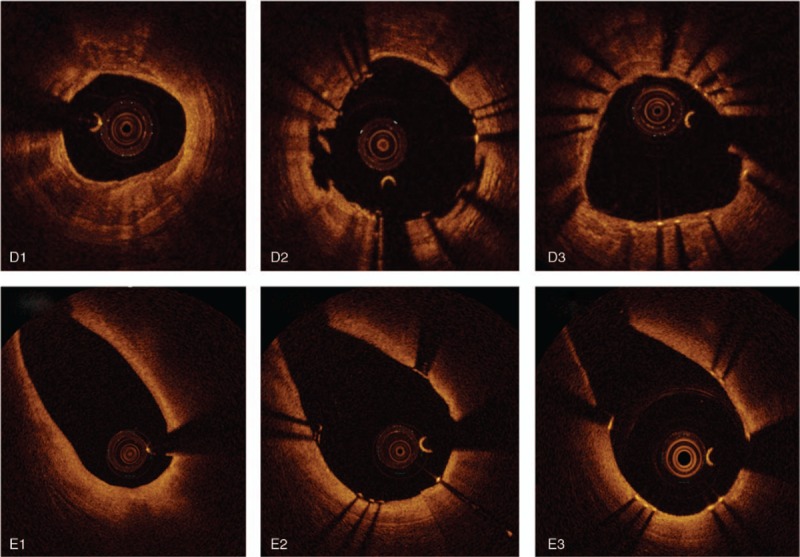
Figure 1 (Continued).

Representative optical coherence tomography (OCT) images of plaque characteristics and neointima evaluation at follow-up study. (A) Stent struts on calcified plaque. (A-1) just after stent deployment, (A-2, 3) follow up study, measured neointima thickness. (B) Stent struts on fibrous plaque. (B-1) Just after stent deployment. (B-2, 3) Follow up study, measured neointima thickness. (C) Stent struts on lipid rich plaque. (C-1) Just after stent deployment. (C-2, 3) Follow up study, measured neointima thickness. (D) Struts adjustment with plaque shape. (D-1) De novo target lesion with calcified plaque (D-2) just after stent deployment, (D-3) follow up study. (E) Struts adjustment with side branch. (E-1) De novo target lesion with side branch. (E-2) Just after stent deployment. (E-3) follow up study.
