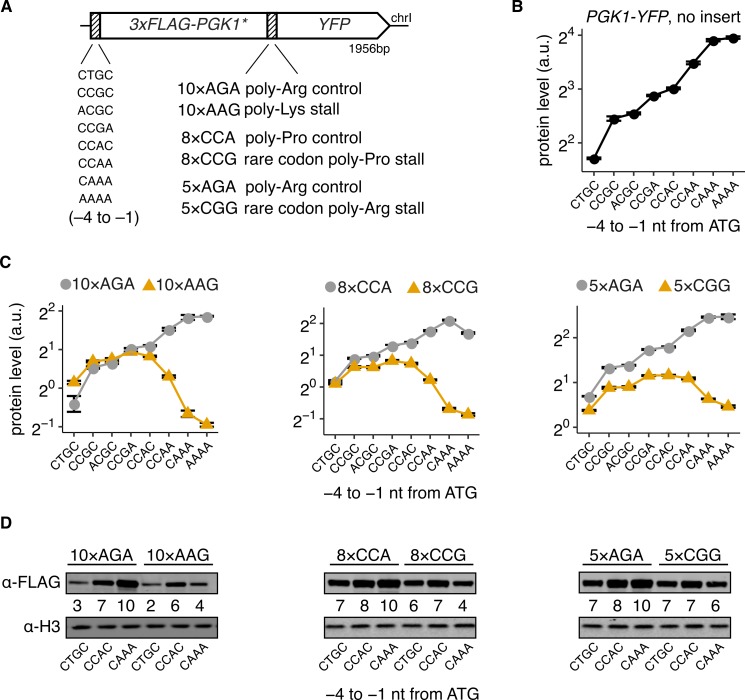
Fig 1. High initiation rates decrease protein output of stall-containing S. cerevisiae mRNAs.
(A) Schematic of 3×FLAG-PGK1*-YFP reporters used in (C) and (D). The −4 to −1 nt region preceding the ATG start codon had one of eight different Kozak sequences as indicated. One of three different stall sequences or their respective controls were inserted at the end of PGK1*. PGK1* was modified from wild-type PGK1 sequence based on a previous study [11] (see Strain and plasmid construction). (B) Protein levels of 3×FLAG-PGK1-YFP control reporters with no insert and wild-type PGK1 sequence. (C) Protein levels of the constructs shown in (A). Protein levels are quantified as the mean YFP fluorescence of 10,000 cells for each strain as measured using flow cytometry. Protein levels are expressed as a.u. relative to the mean RFP levels from a constitutively expressed mKate2 control. Error bars in (B) and (C) show standard error of the mean over three or four independent transformants. Many error bars are smaller than data markers. Two of the total 192 strains were clear outliers and were removed after manual inspection. (D) Western blots of reporters with low (CTGC), medium (CCAC), or high (CAAA) initiation rates and with indicated stall sequences or controls using antibody against the FLAG epitope at the N terminus. Histone H3 level is shown as loading control. Numbers for each lane indicate the ratio of the FLAG signal to the H3 signal and are normalized to a maximum of 10 within each blot. The underlying data for panels B and C can be found at https://github.com/rasilab/ribosome_collisions_yeast. a.u., arbitrary unit; chrI, chromosome I; nt, nucleotide; YFP, yellow fluorescent protein.

