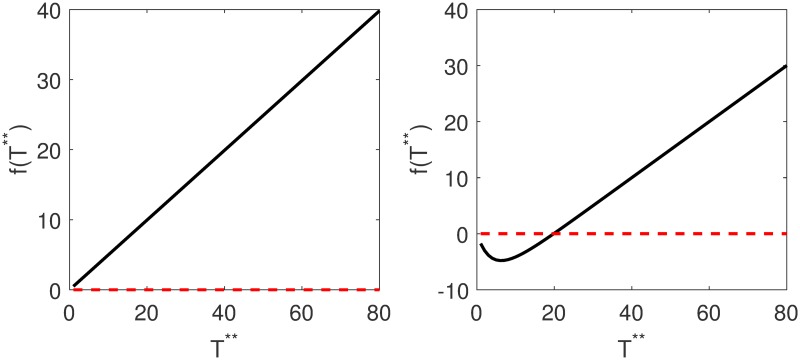
Fig 5. Plots of f(T**) against T** where T** is the equilibrium value of infected cells.
The parameters used were β2 = 0.0000024 for Fig 5 a and β2 = 0.024 for Fig 5 b. The graph does not cross the zero line for small values of β2 and crosses the zero line for large values of β2 and thus there is no solution for small values of the transmission parameter. Existence of the disease equilibrium depends on the rate at which cells are infected. f(T**) is given in Eq 19.

