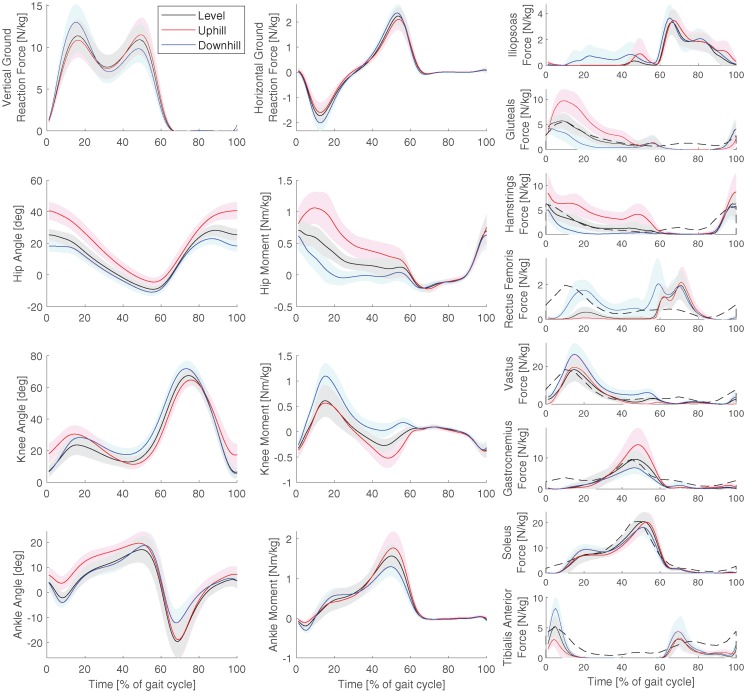
Fig 3. Kinetics and kinematics at the normal speed.
Average ground reaction forces, joint angles, joint moments, and muscle forces for all trials at the normal speed (1.3 m/s). The shaded area denotes one standard deviation. The dashed line shows EMG data of level walking for comparison [34]. The graphs use Winter’s sign convention, where flexion angles and extension moments are positive for hip and knee. Dorsiflexion angle and plantarflexion moment are positive for the ankle.

