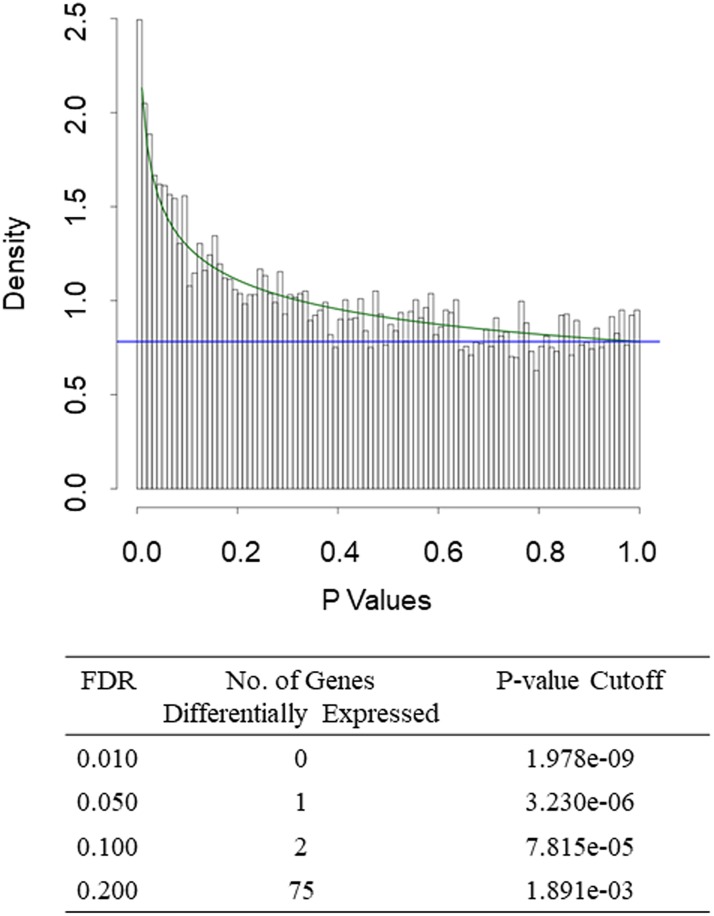
Fig 1. Gene expression in IBC versus non-IBC in 70 patients with non-MSL TNBC according to the Vanderbilt classification.
Top, Histogram of P values from 2-sample t tests for gene expression in TN-IBC vs. TN-non-IBC. The overlaid curve is the fitted BUM model. Bottom, Counts of differentially expressed genes with various FDR cutoffs.

