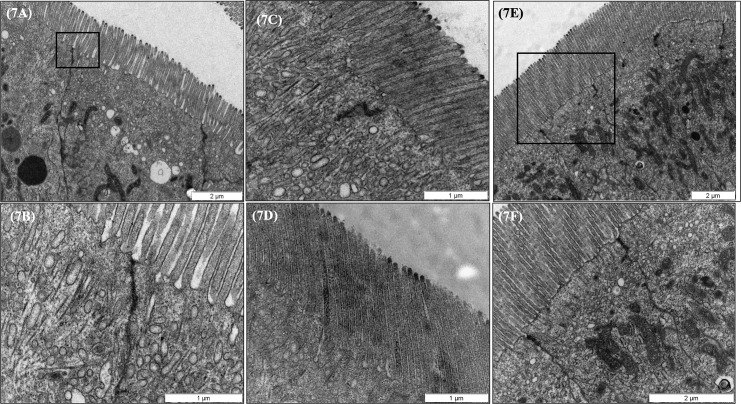
Fig 7. Representative TEM micrographs of the posterior and rectum intestinal regions of European sea bass (Dicentrarchus labrax) fed the different dietary treatments.
(7A) Posterior gut structural pattern observed for all fish studied. Scale bar 2 μm. (7B) Detailed micrograph of posterior gut tight junction (TJ) appearance. Observe the conserved structure. Scale bar 1μm. (7C) Pattern of rectum microvilli length for fish fed control and PHYTO diet and (7D) representative micrograph of rectum microvilli length for fish fed GMOS based diets which were significantly (P<0.05) longer than fish fed the rest of the dietary treatments. Scale bars 1μm. No evident differences were observed in enterocyte packaging, membrane lining appearance (7E), or TJs structure (7F) among dietary treatments for rectum region. Scale bars 2 μm. C (control diet), GMOS (5000 ppm galactomannan oliGMOSaccharides), PHYTO (200ppm phytogenic), GMOSPHYTO (5000 ppm galactomannan oligosaccharides+200ppm phytogenic).

