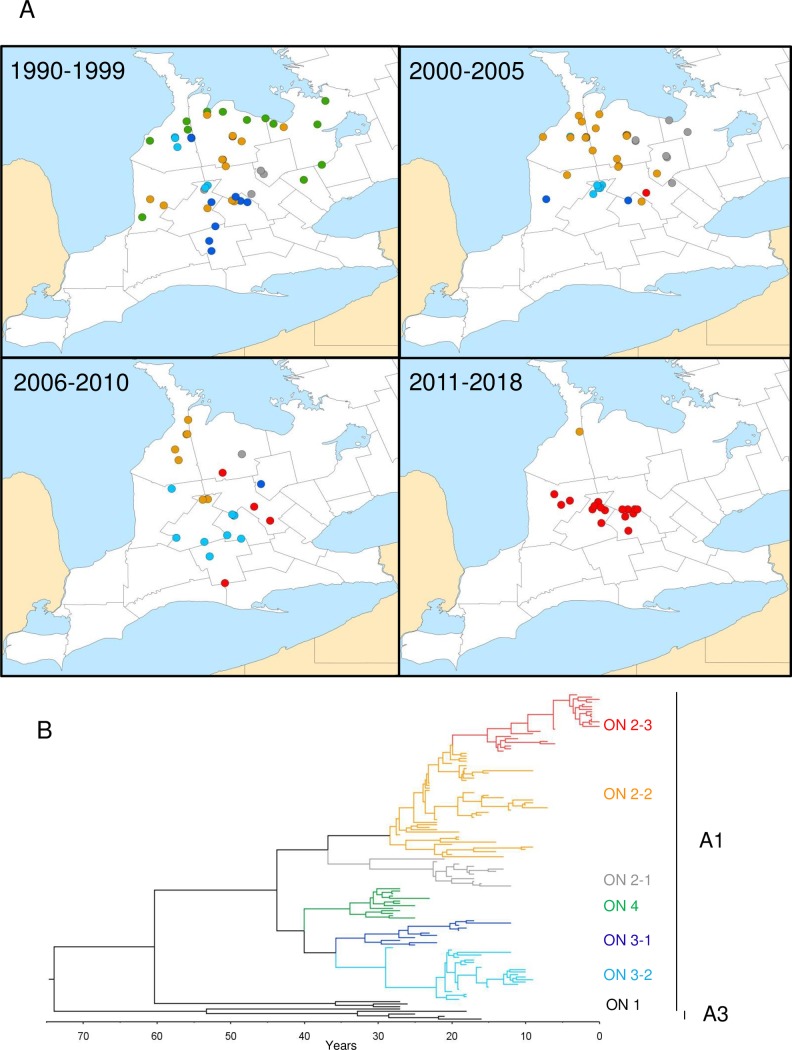
Fig 4.
Maps of the study area showing the locations of all RABV variants over four time periods (panel A). Maps were generated using ARC-GIS software, v. 10. RABV variants and sub-variants are identified by colour-coding as illustrated in the time-scaled MCC tree generated using the BEAST software package (panel B).

