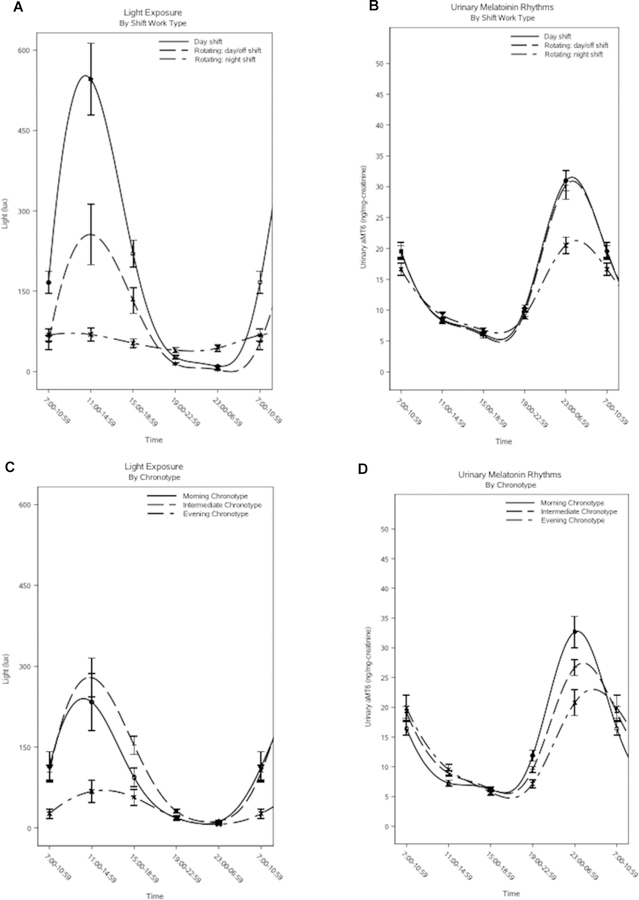
Figure 1. Plots of light exposure and urinary melatonin level across shift-work and chronotype categories.
Figure 1A contains a plot of light exposure (in lux) and Figure 1B contains a plot of urinary melatonin rhythms (in ng/mg-creatinine) for day-shift workers (solid line), rotating-shift workers on day/off shifts (evenly broken line), and rotating-shift workers on night shifts (unevenly broken line). Figure 1C contains a plot of light exposure (in lux) and Figure 1D contains a plot of urinary melatonin rhythms (in ng/mg-creatinine) for morning chronotypes (solid line), intermediate chronotypes (evenly broken line), and evening chronotypes (unevenly broken line).

