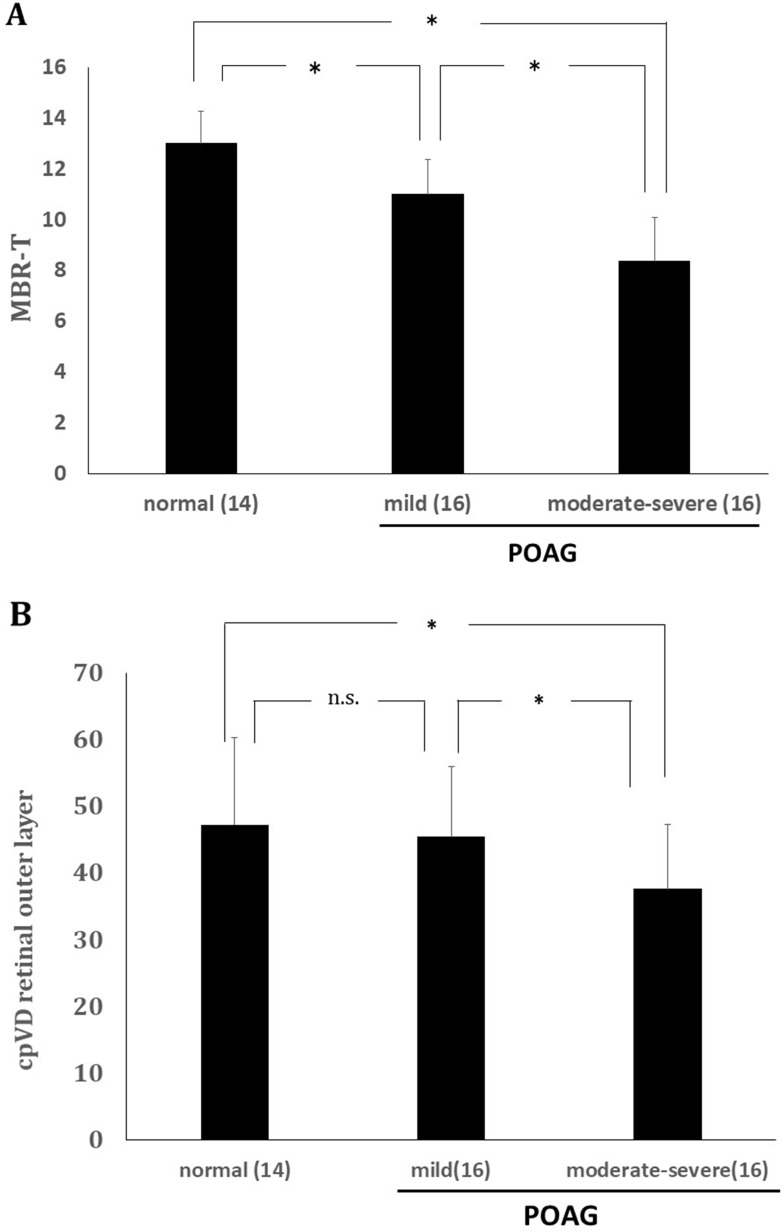
Figure 2.
(A) ONH tissue blood flow (MBR-T, mean ± standard error) changes in normal subjects and patients in each glaucoma stage. P<0.001 (one-way ANOVA), *P<0.01 (Dunnett’s test). (B) Retinal outer layer cpVD changes (mean ± standard error) in each glaucoma stage. P=0.02 (one-way ANOVA), *P<0.01 (Dunnett’s test).
Abbreviations: n.s, not significant; ONH, optic nerve head; MBR-T, tissue mean blur rate; cpVD, circumpapillary vessel density.

