
Fig. 2. RId2−/− NK cells proliferate in response to IL-2 or IL-15.
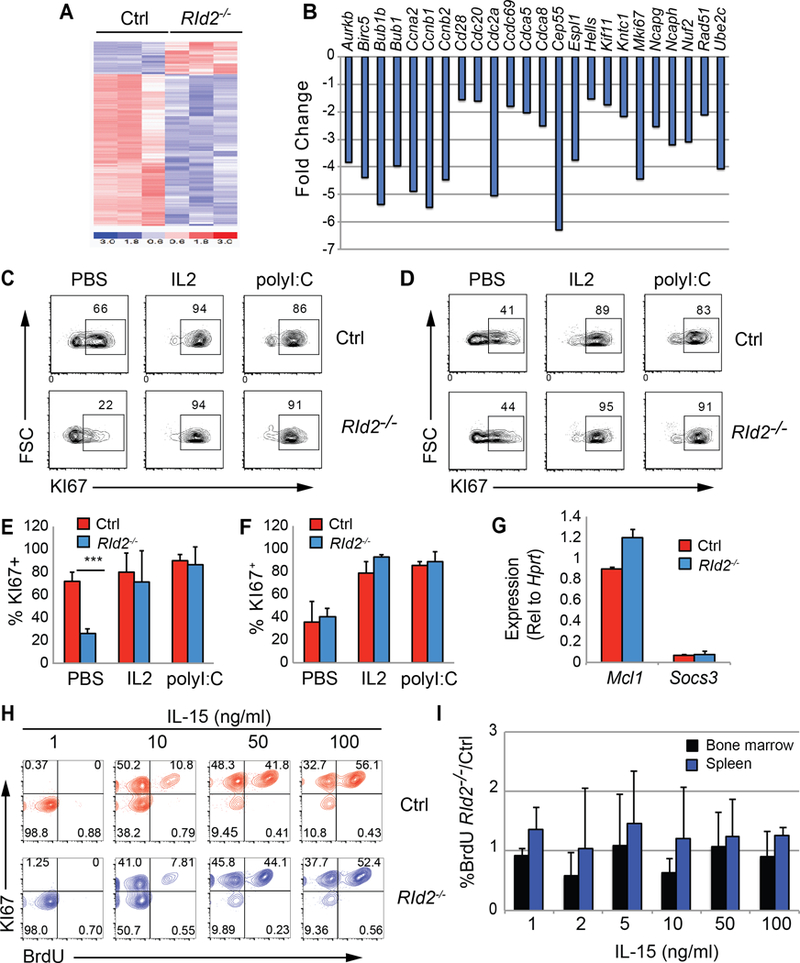
(A) Heat map of probe sets that were differentially expressed by greater than 1.5-fold (P < 0.05) in Ctrl and RId2−/− CD27+CD11b− NK cells. Microarray analysis was performed on RNA isolated in 3 independent experiments. (B) Fold change in expression of a set of differentiation associated probe sets identified by Chiossone et al., (5), in RId2−/− as compared to Ctrl CD27+CD11b− NK cells. (C) Ctrl or RId2−/− mice were injected with PBS, IL-2, or polyI:C and 3 days later the frequency of KI67+ CD27+CD11b− NK cells was determined in the BM (C) or spleen (D) by flow cytometry. Representative of 3 independent experiments. The average frequency of Ctrl (red) or RId2−/− (blue) CD27+CD11b− NK cells expressing KI67 + S.D. 3 days after injection of PBS, IL-2 or polyI:C was determined for the (E) BM and (F) spleen. N=3 ** P<0.01. (G) qRT-PCR for Mcl1 and Socs3 mRNA shown relative to Hprt mRNA in Ctrl (red) or RId2−/− (blue) CD27+CD11b− NK cells from the BM. (H) BM NK cells from Ctrl (red) or RId2−/− (blue) mice were treated with increasing concentrations of IL-15 for 3 days prior to addition of BrdU for 30 minutes. The cells were stained for NK cell surface markers, intracellular BrdU, and KI67. Lin−NKP46+CD49b+CD27+CD11b− cells are shown. Representative of 4 independent experiments. (I) Average ratio + S.D. of the percent of NK cells that were BrdU+ in cultures of RId2−/− as compared to Ctrl CD27+CD11b− NK cells isolated from the BM (blue) or spleen (black), identified as in (H). N = 4.