
Fig. 3. ID2 promotes the cytotoxic effector program of NK cells.
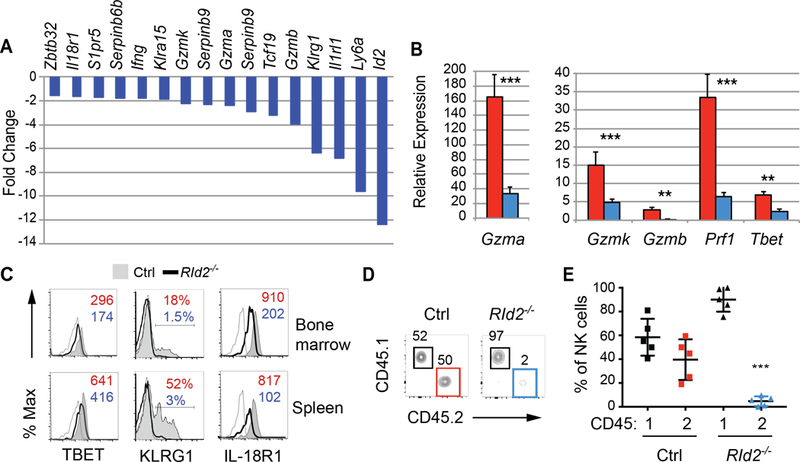
(A) Fold change in expression of probe sets associated with NK cell differentiation or the cytotoxic effector program as measured by microarray analysis. (B) qRT-PCR analysis of Gzma, Gzmb, Gzmk, Prf1 and Tbet mRNA relative to Hprt mRNA in BM CD27+CD11b− NK cells from Ctrl (red) or RId2−/− (blue) mice. Representative of 3 experiments, N=3 per experiment. Error bars are S.D. (C) TBET, KLRG1 and IL-18R1 on CD27+CD11b− NK cells from Ctrl (shaded, grey) or RId2−/− (open, black) mice by flow cytometry. The open grey histogram is the FMO control. The MFI or percent positive cells is indicated for Ctrl (red) and RId2−/− (blue). Representative of 3–8 experiments. (D) Klr8−/− mice were injected with NK cells from the spleen of Ctrl or RId2−/− (CD45.2+) mice along with an equal number of WT CD45.1+ splenic NK cells and infected with MCMV. The percent of Ly49H+ NK cells in the spleen that were CD45.1+ (black gate) or CD45.2+ (red for Ctrl cells and blue for RId2−/− cells) was examined by flow cytometry on day 7. One representative experiment is shown. N=3. (E) Summary of data for multiple NK cell chimeric mice, set up as in (D). Each dot is one mouse. The mean +/− SD is shown. * P<0.05, ** P<.01, ***P<0.005.