
Fig. 5. ID2 represses chromatin accessibility at T cell associated genes by preventing E protein binding.
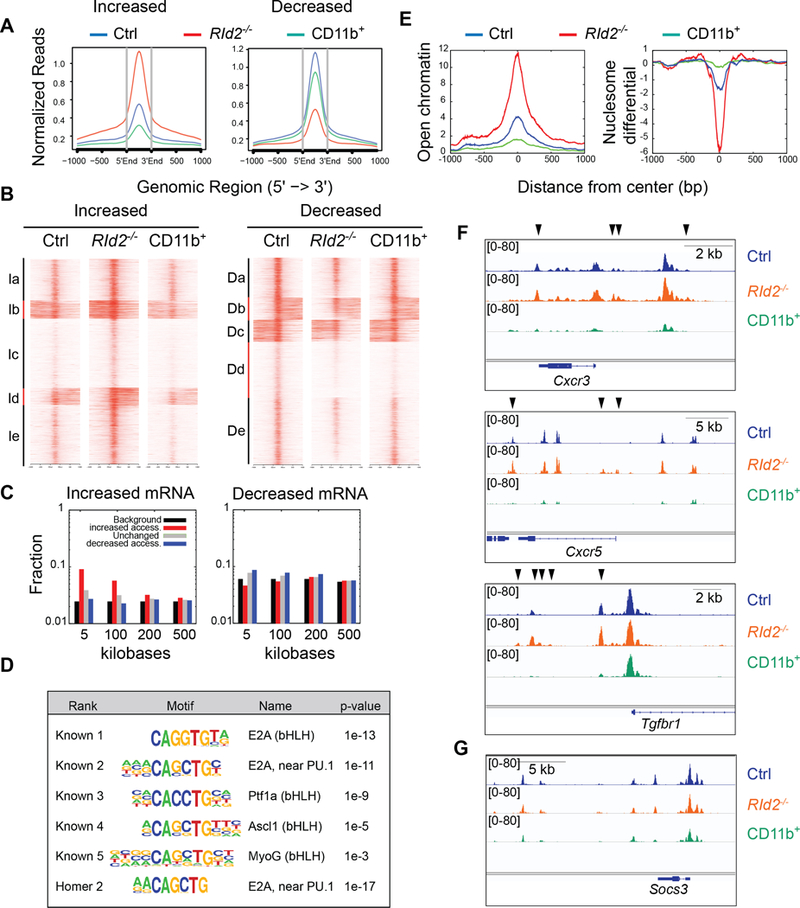
(A) ATAC-sequencing was used to identify regions of open chromatin in RId2−/− (red) and Ctrl CD27+CD27− (blue) NK cells and in Ctrl CD27−CD11b+ (green, labeled as CD11b+) NK cells. The graph shows normalized reads at the indicated distance from the center of open chromatin domains that had increased (left graph) or decreased (right graph) accessibility in RId2−/− as compared to Ctrl CD27+CD11b− NK cells. (B) Heat map and K-means clustering of the regions analyzed in (A) with increased or decreased accessibility in RId2−/− as compared to Ctrl CD27+CD11b− NK cells. (C) Fraction of genomic regions that showed increased accessibility (red) decreased accessibility (blue) or no change in accessibility (grey) in RId2−/− CD27+CD11b− NK cells and were associated with genes that increased (left plot) or decreased (right plot) expression by greater than 2-fold. Black represents the background/null distribution (all genes in the genome) (D) HOMER motif enrichment at regions with increased accessibility near genes that increased expression in RId2−/− compared to Ctrl NK cells. (E) Normalized reads for open chromatin (left) and nucleosome differential (right) centered over E box motifs associated with genes that increased expression in RId2−/− NK cells. (F) Accessible chromatin at the Cxcr3, Cxcr5, and Tgfbr1 genes in RId2−/− (orange) and Ctrl (blue) CD27+CD11b− NK cells and Ctrl CD11b+ NK cells (green) in viewed in IGV. Black arrows indicate regions that are more accessible in RId2−/− compared to Ctrl. (G) Same as (F) but for the Socs3 gene.