
Fig. 7. ID3 is required for development of ID2-deficient NK cells.
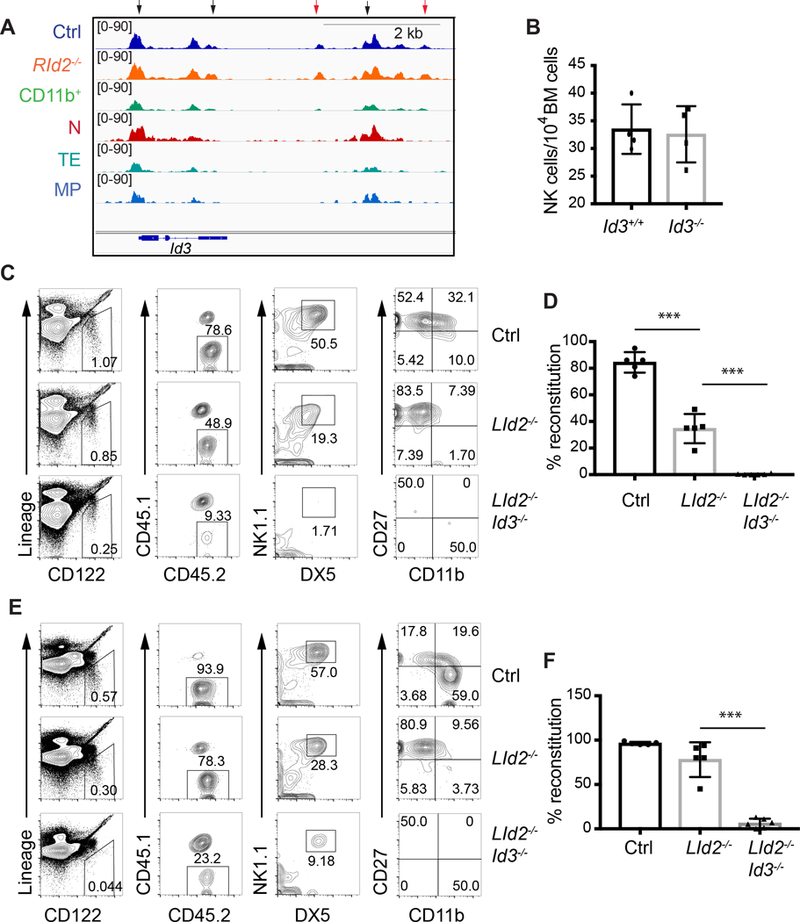
(A) Accessible chromatin tracks for the indicated populations surrounding the Id3 gene. Arrows indicate regions that are more accessible in RId2−/− as compared to Ctrl NK cells. The red arrows indicate peaks unique to NK cells. (B) CD45.2+ CD3ε−TCRβ−TCRδ−NK1.1+DX5+ NK cell numbers/104 BM cells in chimeric mice created by transplanting Id3+/+ (black) or Id3−/− (grey) bone marrrow into lethally irradiated CD45.1+ mice. Each circle represents one transplanted mouse with a unique donor. N = 4. (C) Flow cytometry of BM for CD45.2+ NK cells in CD54.1+ mice transplanted with CD45.2+ Ctrl, LId2−/− and LId2−/−Id3−/− BM. Each row of plots is gated on the population indicated in the row to the left. Lineage = CD3ε, TCRβ, TCRγ. (D) Average percent reconstitution, determined as the percent of Lin−CD122+NK1.1+DX5+ cells that were CD45.2+ + S.D. is shown for each population. N= 5. (E) and (F) are for the spleen as in (C) and (D). ** P<0.01, *** P<0.001.