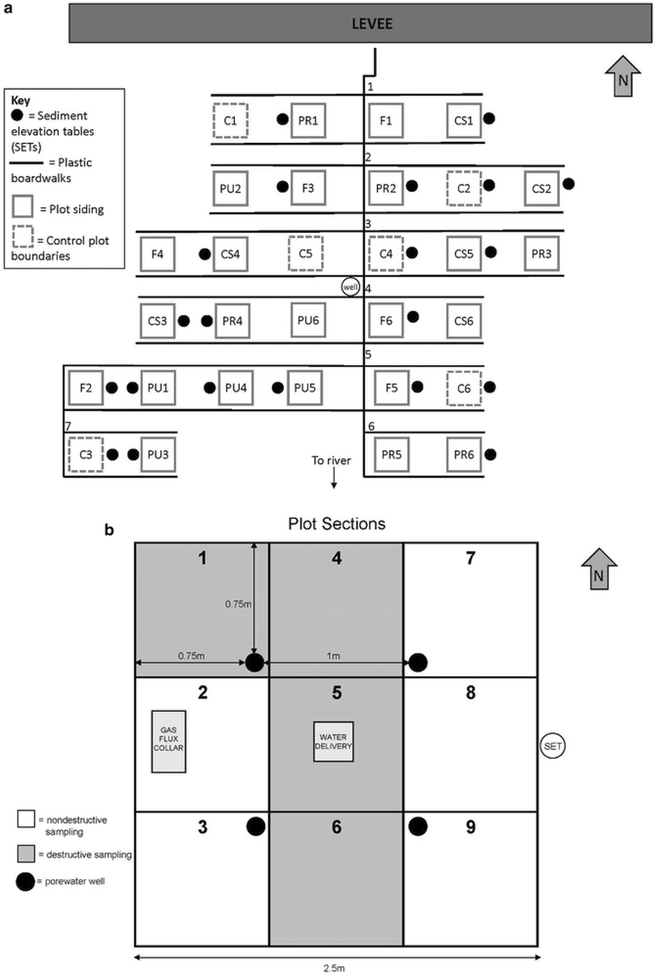
Fig. 1.
a Plot layout map for the SALTEx site. Plot names (treatment abbreviation + replicate) are indicated within the boundaries of each plot. b Sampling locations within the individual plots. Porewater wells are indicated with black circles, gas flux measurements were made in Sect. 2, and soil samples were collected from Sect. 6. The gas flux collar is made of ~ one inch thick aluminum siding and was moved between plots (i.e., not permanently installed) during the study period

