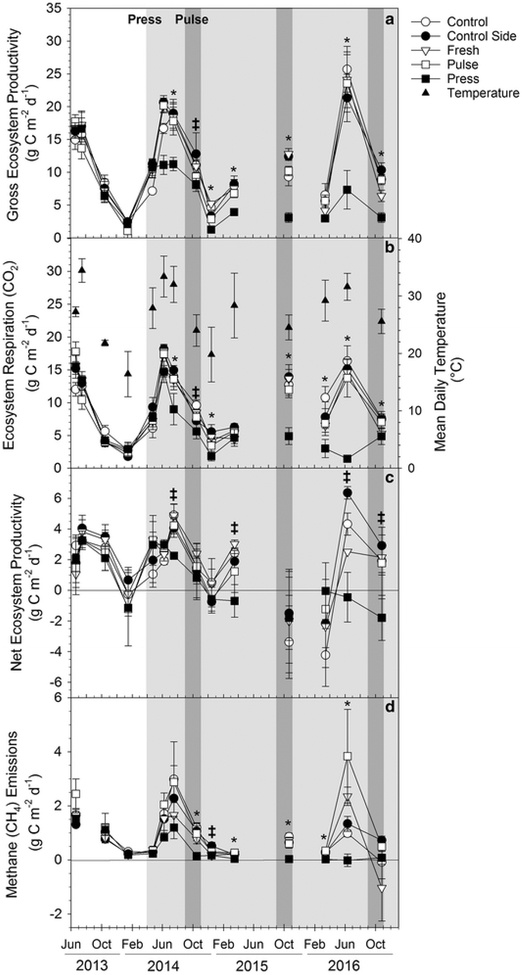
Fig. 4.
Mean modeled daily rates of a GEP, b ER, c NEP and d CH4 emissions (± SE) in g Cm−2 d−1 calculated from field gas flux rates measured seasonally in all treatments. Solid triangles in (b) are mean daily air temperature (± SE). The white portion of the graph represents pre-treatment salinity, the light grey shading the press seawater addition, and the dark grey shading the simultaneous pulse and press seawater addition. Control (open circle), control sides (solid circle), fresh (open triangle) and pulse (open square) values are never significantly different from one another (p > 0.05). Press (solid square) values marked with a * are significantly different from other treatments at α = 0.05 and those with a ‡ at α = 0.1 (Ryan-Einot-Gabriel-Welsch Multiple Range Test)

