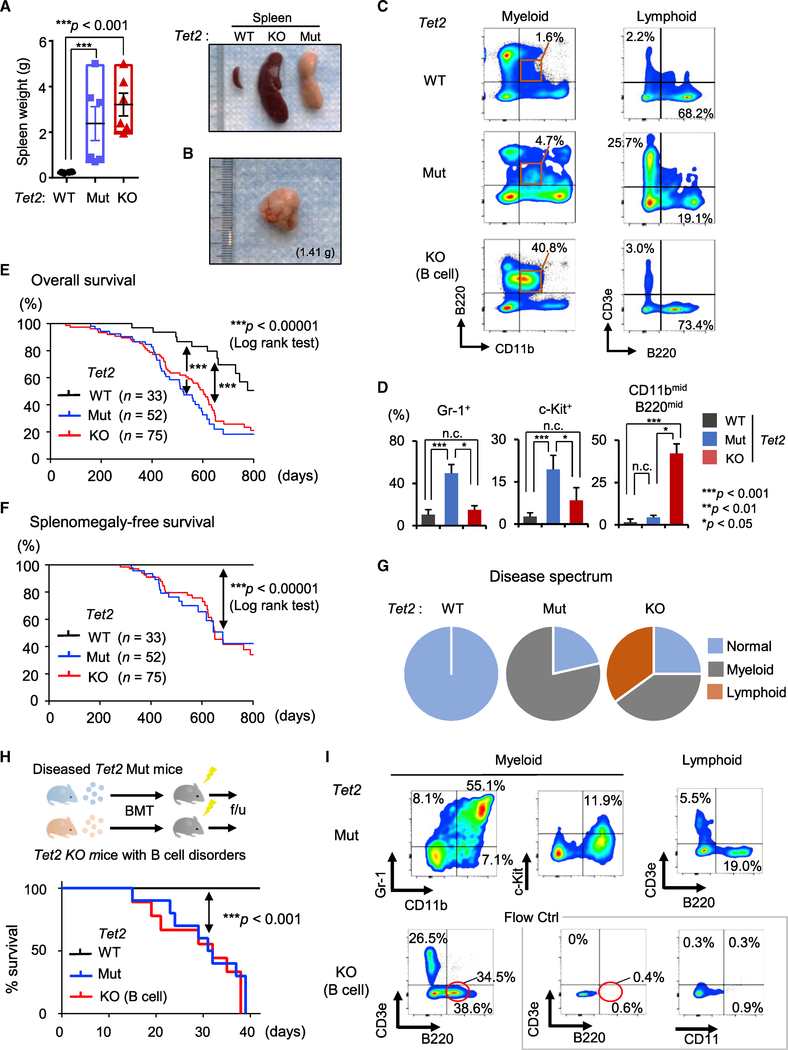
Figure 3. Characterization of Hematological Malignancies in Tet2 Catalytic Mut Mice.
(A and B) Spleen weight (n = 3–6; A, left). Representative images of spleens from Tet2 Mut mice with myeloid phenotypes and Tet2 KO mice with lymphoid phenotypes (A, right) (10 months old). Representative images of lymph nodes from Tet2 Mut mice with myeloid phenotypes (B).
(C and D) Representative flow data for myeloid and lymphoid lineages in spleens from Tet2 Mut mice with myeloid phenotypes (C, middle) and Tet2 KO mice with lymphoid phenotypes (C, bottom) (10 months old). The percentages of indicated fractions in spleens from Tet2 Mut and Tet2 KO mice are shown (D, n = 6).
(E and F) Kaplan-Meier survival curves of overall survival (E) and splenomegaly-free survival (F) of Tet2 Mut and KO mice. The number of mice in each group are shown in parenthesis. Log-rank test was used to generate p values.
(G) Disease spectrum in Tet2 Mut and KO mice (n = 16, 18, respectively).
(H and I) Schematic of transplantation of diseased bone marrow (H, top). Survival curve of transplanted mice (H, bottom, n = 10 for Mut, 9 for WT and KO). All recipient mice transplanted with Tet2 Mut bone marrow developed lethal myeloid malignancies within 6 weeks after bone marrow transplantation (BMT) (H, bottom). Representative flow cytometric analysis for myeloid and lymphoid lineages in PB of recipient mice transplanted with Tet2 Mut (I. top) or KO (I. bottom) bone marrow, 3 weeks after BMT are shown.
Error bars indicate SD. n.c. stands for no significant change. See also Figure S3.

