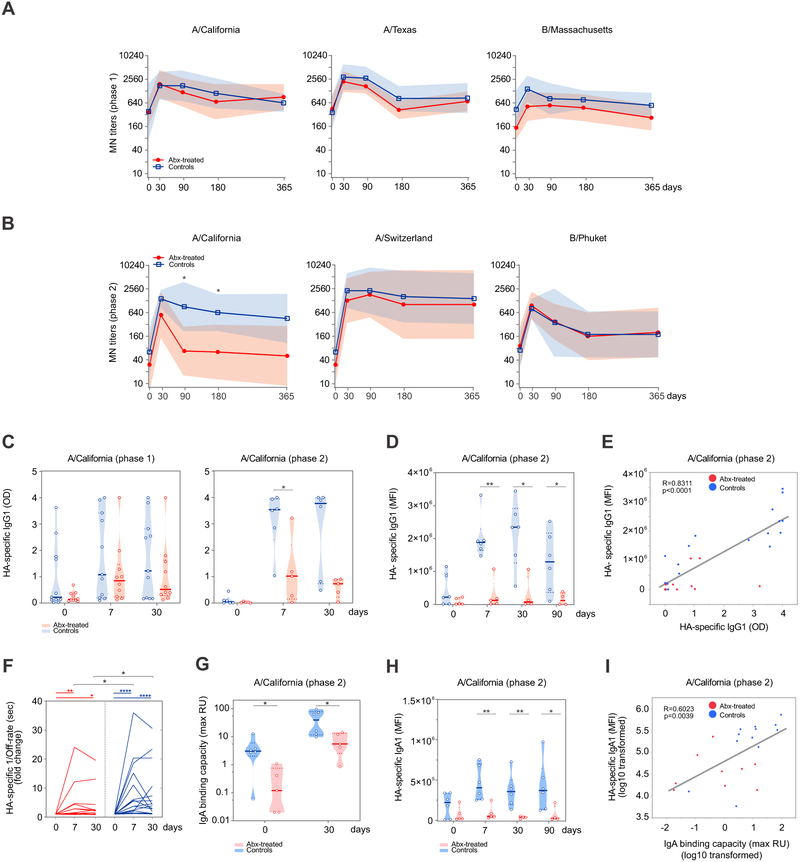
Figure 2. Impact of antibiotics treatment on humoral responses to TIV.
(A-B) Microneutralization (MN) titers against the 3 influenza strains contained in the 2014-2015 (A) and 2015-2016 (B) TIV formulations. Geometric means are presented in thick lines, while shades are for geometric standard deviations (SD).
(C) IgG1-binding to A/California H1 for phase 1 (left panel) and phase 2 (right panel) measured by ELISA. Violin plots show sample distributions. Each circle represents an individual subject, while medians are presented in thick lines.
(D) Relative concentration of A/California H1 HA-specific IgG1 for phase 2 determined using a high-throughput Luminex-based assay (Brown et al., 2012). Violin plots show sample distributions. Each circle represents an individual subject, while medians are presented in thick lines.
(E) Scatterplot of A/California H1 HA-specific IgG1 measured by ELISA vs A/California H1 HA-specific IgG1 measured by Luminex for phase 2 subjects on days 0, 7, 30. Each dot represents one subject.
(F) Off-rate measurements in seconds (sec) by surface plasmon resonance (SPR) to assess antibody affinity to A/California H1. The data is presented as reciprocally transformed and as fold change over the baseline. Each line represents one subject.
(G) A/California H1 HA-specific IgA isotype binding capacity measured by SPR and presented as maximum resonance units (max RU) for phase 2 subjects. Violin plots show sample distributions. Each circle represents an individual subject, while medians are presented in thick lines.
(H) Relative concentration of A/California H1 HA-specific IgA1 for phase 2 determined using a high-throughput Luminex-based assay, as for panel D. Violin plots show sample distributions. Each circle represents an individual subject, while medians are presented in thick lines.
(I) Scatterplot of A/California H1 HA-specific IgA isotype binding capacity measured by SPR vs A/California H1 HA-specific IgA1 measured by Luminex for phase 2 subjects on days 0 and 30. Each dot represents one subject. See STAR Methods for further details.
Where calculated, comparisons between control and antibiotics-treated groups at specific time points were performed by Mann-Whitney tests (panels A-D, F-H). Wilcoxon matched-pairs signed rank tests were used to compare time points within the same group (panel F). Pearson correlation was used for panels E and I. *p<0.05; **p<0.01; ***p<0.001; ****p<0.0001.
See also Figures S2 and S3.

