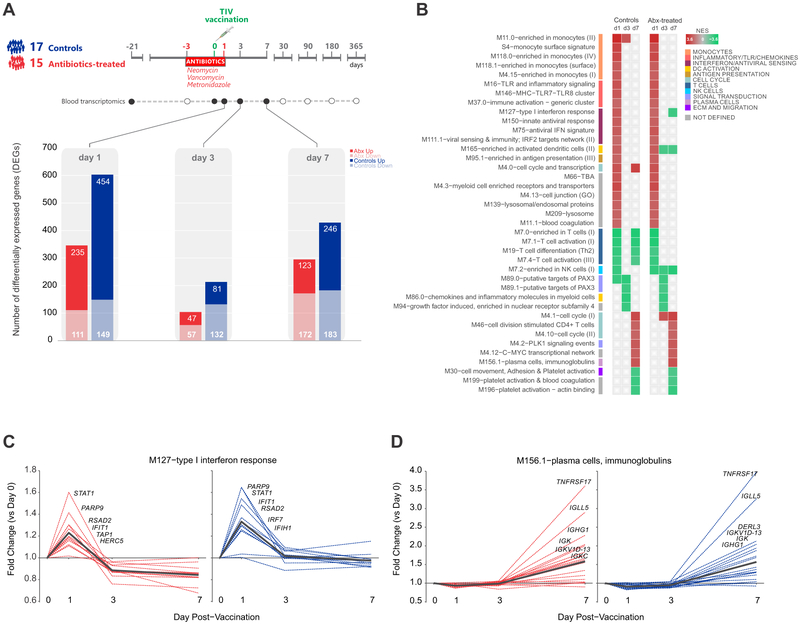
Figure 3. Transcriptional Responses to TIV in Control and Antibiotics-Treated Subjects.
(A) Number of genes differentially expressed (log2 fold-change > 0.2 and t-test p value < 0.01) relative to day 0 in control and antibiotics-treated subjects on days 1, 3, and 7 post-vaccination.
(B) BTMs significantly enriched (FDR < 0.05, NES ≥ 2) in control and antibiotics-treated subjects post-vaccination. GSEA (Subramanian et al., 2005) was used to identify positive (red) or negative (green) enrichment of BTMs using ranked gene lists, where genes were ordered by t-statistic based on post-vaccination fold change relative to day 0.
(C-D) Temporal expression patterns of genes within modules M127 and M156.1 among antibiotics-treated (red) and control subjects (blue). Black line represents the mean fold change of all genes.
See also Figure S4 for comparison of responses in phases 1 and 2.

