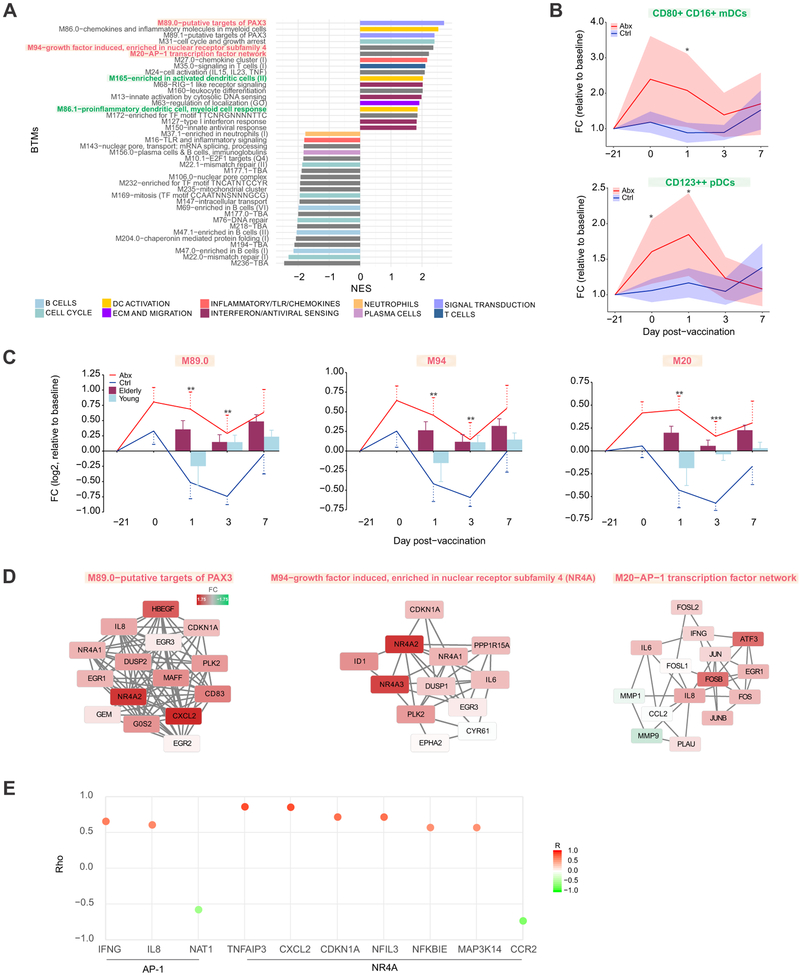
Figure 4. Transcriptional and Cellular Responses to Antibiotics Administration.
(A) BTMs significantly enriched (FDR < 0.05) following antibiotics use. GSEA (Subramanian et al., 2005) was used to compute the normalized enrichment score (NES) of BTMs using ranked gene lists, where genes were ordered by t-statistic based on day 0 versus screening (day −21) fold change in antibiotics-treated subjects. Enriched modules are colored according to their high-level functional annotation.
(B) Kinetics of dendritic cell subsets following antibiotics administration and vaccination. Solid lines represent mean fold change and shaded areas represent 95% confidence interval.
(C) Kinetics of AP-1/NR4A related BTMs following antibiotics administration and vaccination. Solid lines represent average module expression among antibiotics-treated (red) and control subjects (blue), and bar plots represent average module expression among young (< 65 years, light blue) and elderly (≥ 65 years, maroon) subjects vaccinated with TIV during the 2010-2011 influenza season (Nakaya et al., 2015). Error bars represent standard error of the mean (SEM).
(D) Genes in AP-1/NR4A related BTMs. Each “edge” (gray line) represents a coexpression relationship, as described in Li et al. (Li et al., 2014); colors represent the day 0 versus screening (day −21) log2 fold change (positive – red, negative – green).
(E) Spearman correlation of AP-1/NR4A target genes (from TRANSFAC (AP-1) or Pei et al. (Pei et al., 2006) (NR4A)) with their corresponding transcription factors on day 1. For AP-1 the average expression of FOS/JUN was used, and for the NR4A family the average of NR4A1/2/3 was used to compute the correlation.
Where calculated, comparisons between control and antibiotics-treated groups at specific time points were performed by Student’s t-tests. *p<0.05; **p<0.01; ***p<0.001; ****p<0.0001.

