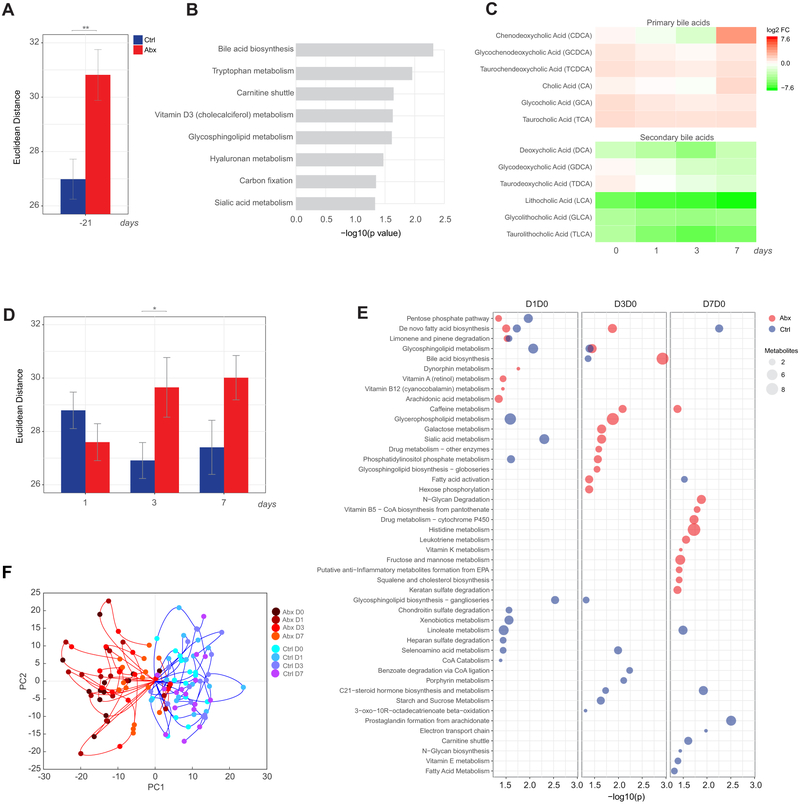
Figure 5. Impact of antibiotics administration and influenza vaccination on the blood metabolome.
(A) Euclidean distance across the most variable metabolite features (coefficient of variation >8% across all time points) between the day 0 and screening (day −21) time point in control (blue) and antibiotics-treated (red) subjects. Error bars represent standard error of the mean (SEM).
(B) Metabolic pathways significantly enriched following antibiotics administration. Mummichog software (Li et al., 2013) was used to identify enriched pathways (p<0.05 by permutation test) based on differential metabolite features (p<0.05 by Student’s t-test) between the day 0 and screening (day −21) time point in antibiotics-treated subjects.
(C) Fold change of primary and secondary bile acids in antibiotics-treated subjects on days 0-7 relative to the screening time point (day −21).
(D) Euclidean distance across the most variable metabolite features (coefficient of variation >8% across all time points) on days 1-7 post-vaccination relative to day 0 in control and antibiotics-treated subjects. Error bars represent standard error of the mean (SEM).
(E) Metabolic pathways significantly enriched (p<0.05) following influenza vaccination in control and antibiotics-treated subjects.
(F) Metabolic trajectories along the first two principal components for control and antibiotics-treated subjects for days 0-7 relative to the screening time point. Here metabolic trajectories refer to the trajectory of each subject according to the changes in abundance across all differential metabolite features (p<0.01) throughout the time course of the study (days 0-7) when projected in the principal component space.
Where calculated, comparisons between control and antibiotics-treated groups at specific time points were performed by Student’s t-tests. *p<0.05; **p<0.01; ***p<0.001; ****p<0.0001.
See also Figure S4 for comparison of responses in phases 1 and 2.

