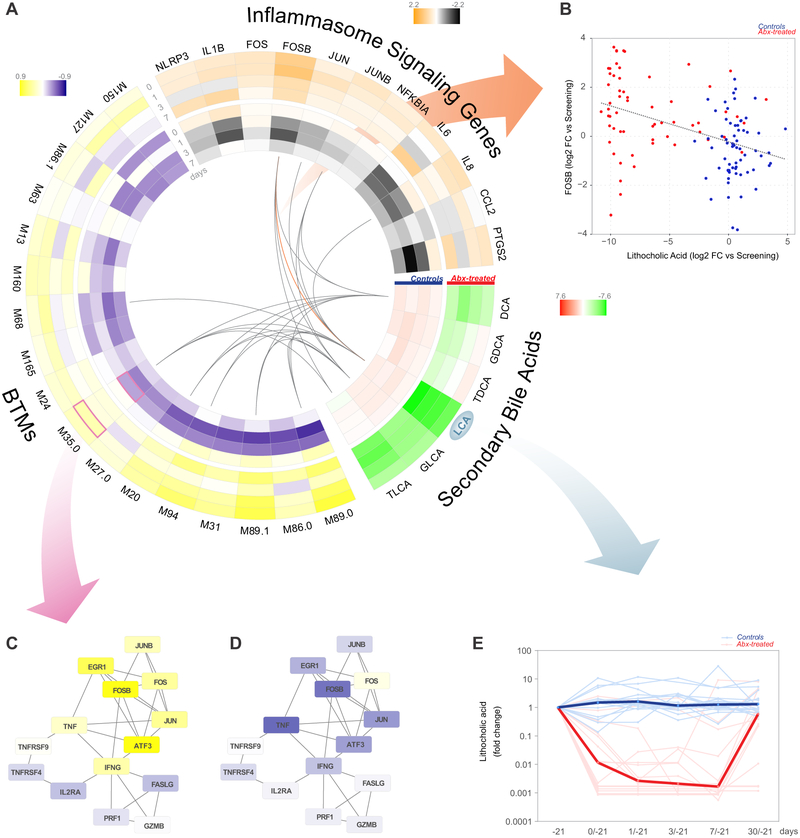
Figure 6. Perturbation of secondary bile acids is associated with elevated NLRP3 inflammasome signaling in antibiotics-treated subjects.
(A) Circos plot showing the log2 fold change in secondary bile acids, antibiotics-induced BTMs (Figure 4A), and inflammasome signaling genes on days 0-7 relative to screening (day −21) in control and antibiotics-treated subjects. Lines indicate significant correlations (p<0.01, Pearson correlation across all time points).
(B) Scatterplot of FOSB expression versus fold change of LCA in the plasma (all time points). Each dot represents one subject.
(C-D) Fold change of genes in M35.0 in (C) antibiotics-treated and (D) control subjects. Each “edge” (gray line) represents a coexpression relationship; colors represent the day 1 versus screening (day −21) log2 fold change (positive – yellow, negative – blue).
(E) Fold change of LCA in the plasma among antibiotics-treated (red) and control (blue) subjects. Each thin line represents a single subject, thick lines represent geometric means.
See also Figure S4 for comparison of LCA fold changes in phases 1 and 2.

