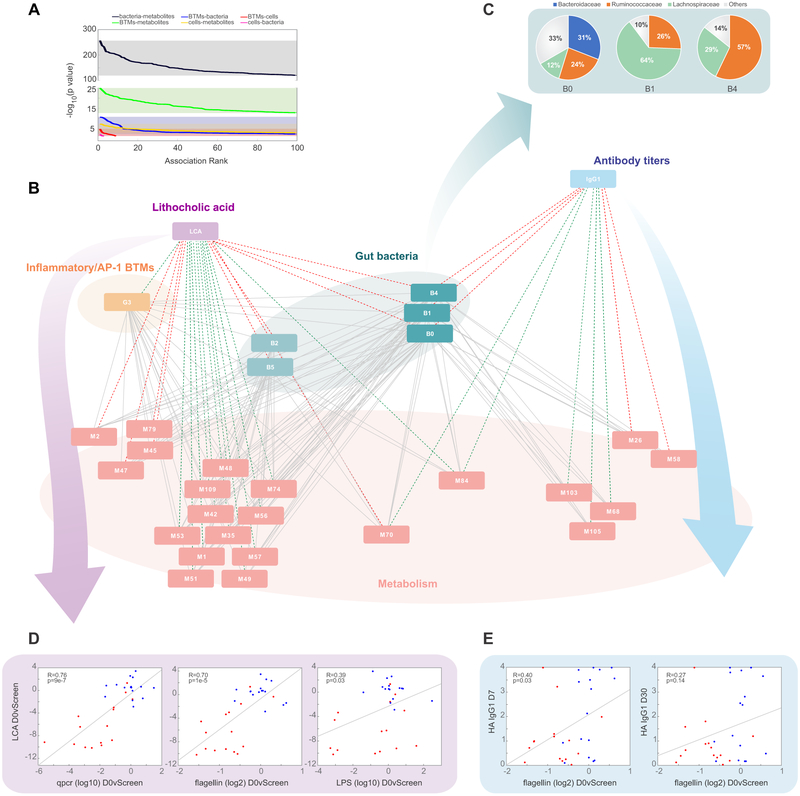
Figure 7. MMRN analysis suggests distinct functions of the gut microbiome in regulating inflammatory signaling and H1N1-specific IgG1 responses.
(A) Distribution of p values between the different data types included in the MMRN.
(B) Sub-network visualization of the day 0 vs screening connections in the MMRN, containing nodes associated with either LCA or H1N1-specific IgG1. Each node is a cluster of features from one data type. The links between nodes (gray) were established by significant association (FDR < 0.05) using partial least square regression and permutation test. The network was queried through an enrichment based approach to identify positive (red) or negative (green) associations (FDR < 0.05, NES > 2.6) between antibiotics-induced (day 0 vs screening) changes in the nodes with either the day 0 vs screening change in LCA or the day 30 abundance of H1N1-specific IgG1. Individual cluster features are provided in Table S3. See Figure S5 and STAR Methods for details of MMRN construction.
(C) Pie charts showing the family membership of OTUs within bacterial clusters B0, B1, and B4.
(D) Scatterplots of plasma levels of LCA versus changes in bacterial load (measured by 16s rRNA qPCR), LPS, and flagellin (day 0 versus screening fold change). Each dot represents one subject.
(E) Scatterplots of the day 7 and day 30 abundance of H1N1-specific IgG1 versus flagellin measured in the stool (day 0 versus screening fold change). Each dot represents one subject.

