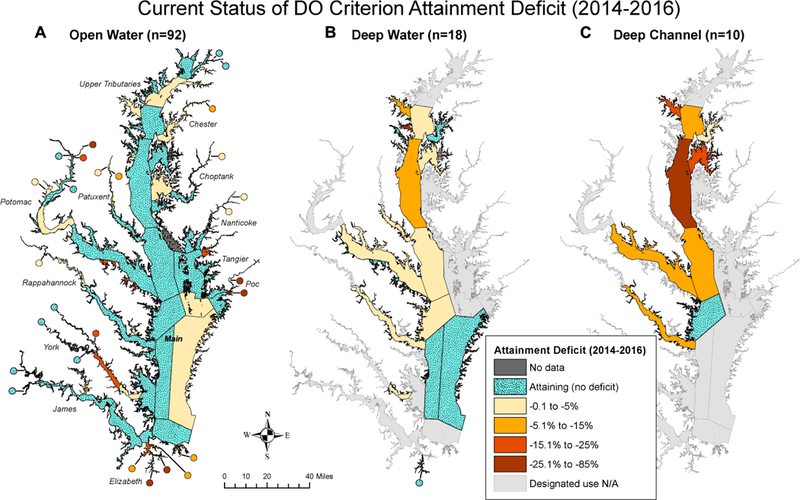
FIGURE 5 |.

Maps showing the current status (i.e., 2014–2016 period) of estimated attainment deficit for Chesapeake Bay dissolved oxygen criterion for applicable segments for (A) open water, (B) deep water, and (C) deep channel.

Maps showing the current status (i.e., 2014–2016 period) of estimated attainment deficit for Chesapeake Bay dissolved oxygen criterion for applicable segments for (A) open water, (B) deep water, and (C) deep channel.