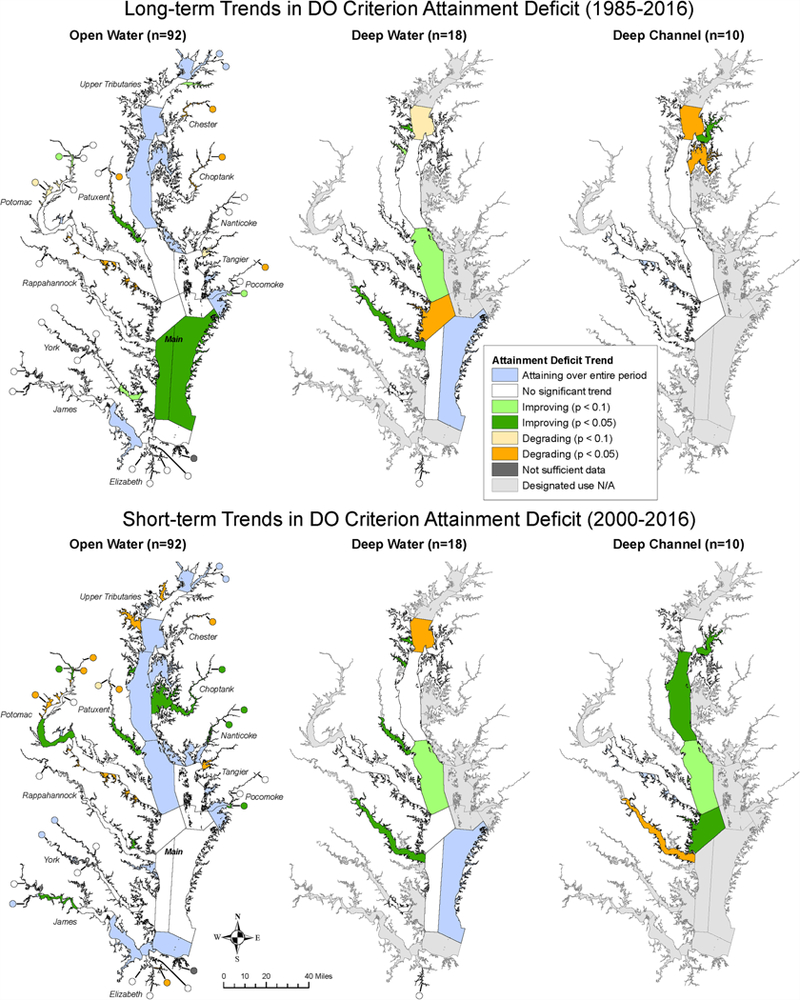
FIGURE 7 |.

Maps showing long-term (Top) and short-term (bottom) trends in estimated attainment deficit for Chesapeake Bay dissolved oxygen criterion for applicable segments for open water, deep water, and deep channel.

Maps showing long-term (Top) and short-term (bottom) trends in estimated attainment deficit for Chesapeake Bay dissolved oxygen criterion for applicable segments for open water, deep water, and deep channel.