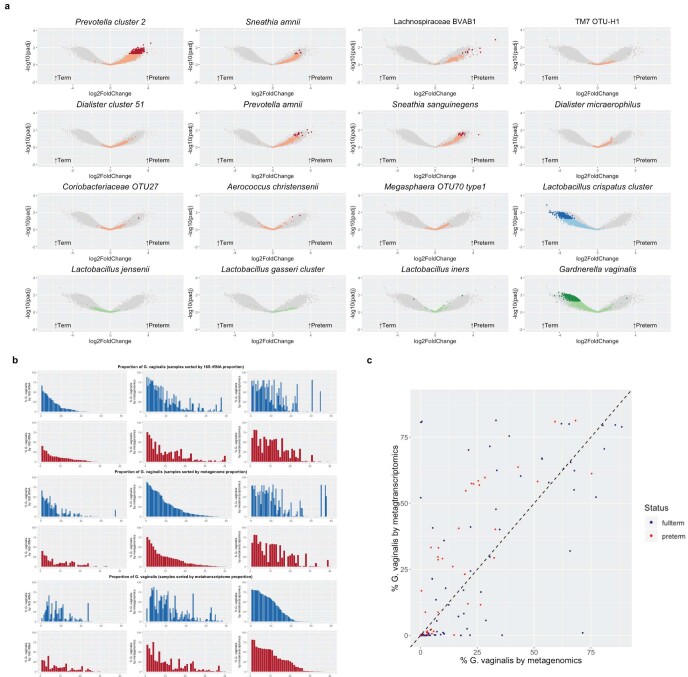
Extended Data Figure 7. Genes differing in metagenomic and metatranscriptomic data between term and preterm cohorts.
a, Volcano plot depicting genes that significantly differ between term (n = 41) and preterm (n = 81) cohorts in metagenomics data. Genes mapping to PTB-associated taxa, the L. crispatus cluster and four other common taxa that significantly differ at Padj < 0.05 (two-sided) with FDR correction are shown in dark red, dark blue and dark green, respectively. b, Comparison of proportional abundance of G. vaginalis in preterm (red) and term (blue) vaginal samples as assayed by 16S rRNA (left), metagenomics (middle) and metatranscriptomics (right), sorted by 16S rRNA (top), metagenomics (middle) and metatranscriptomics (bottom) data. c, Scatter plot of the abundance of G. vaginalis by metagenomics (x axis) and abundance of G. vaginalis by metatranscriptomics (y axis) in pregnant women who delivered term (blue) or preterm (red). Two-sided Wilcoxon’s test of the ratio of the log-transformed proportions (log(metatranscriptomics G. vaginalis proportion)/log(G. vaginalis metagenomics proportion)) showed a significant difference between term and preterm groups (P = 0.01069).

