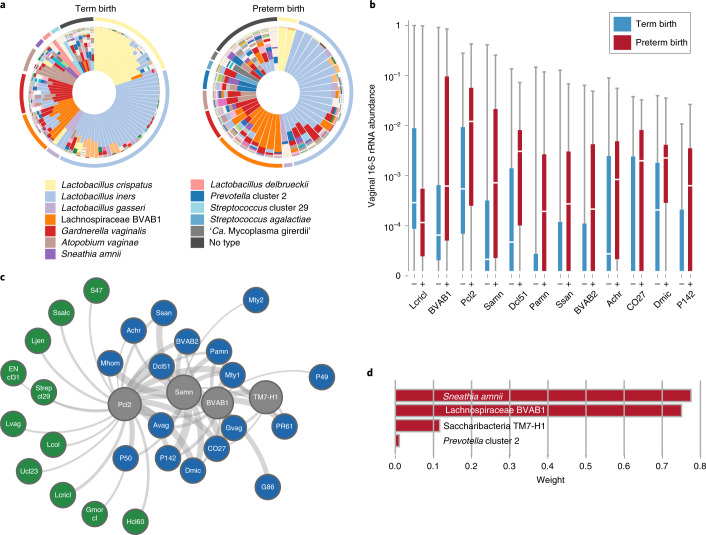
Fig. 2. Bacterial taxa associated with spontaneous PTB.
a, Vagitypes of 90 women who delivered at term (≥39 weeks of gestation), and 45 women who delivered prematurely (<37 weeks of gestation) showing 13 community states, or vagitypes. b, Abundance of taxa significantly different in PTB (n = 45) and TB (n = 90) cohorts. These taxa have P <0.05 for the Mann–Whitney U-test (two-sided) for difference in proportional abundance between the cohorts, corrected using the Benjamini–Hochberg procedure with an FDR of 5%. TB is indicated in blue as (–) and PTB in red as (+). Boxes show the median and interquartile range; whiskers extend from minimum to maximum values within each cohort. c, Network analysis of four taxa highly associated with PTBs. Negative correlations are shown in green, positive correlations in blue and predictive taxa in gray. Edge weights represent the strength of correlation. See Supplementary Table 3 for abbreviations. d, Predictive linear model for PTBs that produces a score based on weighted log(abundances) of four taxa in vaginal 16S rRNA profiles in the 6- to 24-week gestational age range. Taxa abbreviations: Lcricl, L. crispatus cluster; BVAB1, Lachnospiraceae BVAB1; Pcl2, Prevotella cluster 2; Samn, S. amnii; Dcl51, Dialister cluster 51; Pamn, P. amnii; BVAB2, Clostridiales BVAB2; CO27, Coriobacteriaceae OTU27; Dmic, Dialister micraerophilus; P142, Parvimonas OTU142.

