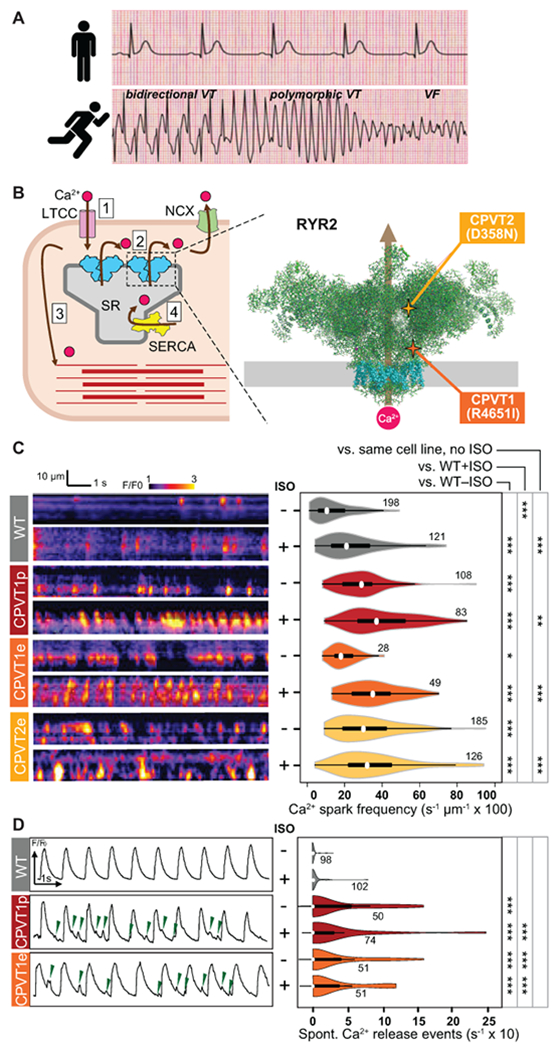
Figure 1. Characterization of Ca2+ oscillations in iPSC-CM clusters.

A. CPVT patients have normal resting electrocardiograms but severe, potentially life-threatening arrhythmias with exercise. VT, ventricular tachycardia. VF, ventricular fibrillation. Traces are idealized sketches shown for illustration purposes. B. CPVT pathophysiology. Left, cartoon of cardiomyocyte Ca2+-induced Ca2+ release. 1. Action potential opens L-type Ca2+ channel (LTCC); 2. Ca2+ induces opening of RYR2 and release of Ca2+ from the sarcoplasmic reticulum (SR); 3. Elevated intracellular Ca2+ induces myofilament contraction; 4. Ca2+ is cleared from the cytosol by SERCA and NCX. Right, CPVT mutations in RYR2 increase diastolic Ca2+ leak. Cartoon shows RYR2 structure based on CryoEM data2. Grey rectangle indicates the sarcoplasmic reticulum membrane. Transmembrane domains are shown in cyan. CPVT-causing RYR2 mutations in this study are highlighted. C. Incidence of Ca2+ sparks in quiescent iPSC-CMs. Left, representative confocal line scans of Fluo-4 signal within individual iPSC-CMs in cell clusters. Right, quantitative analysis. Number by each shape denotes number of cells examined. D. Incidence of spontaneous Ca2+ release events in spontaneously beating iPSC-CMs. Left, representative Ca2+ signal traces, spatially averaged over confocal line scans within individual iPSC-CMs in cell clusters. Green arrowheads indicate spontaneous Ca2+ release events. Right, quantitative analysis. Number by each shape denotes number of cells examined. Steel Dwass non-parametric test with multiple testing correction: *, P<0.05; **, P<0.01, ***, P<0.001
