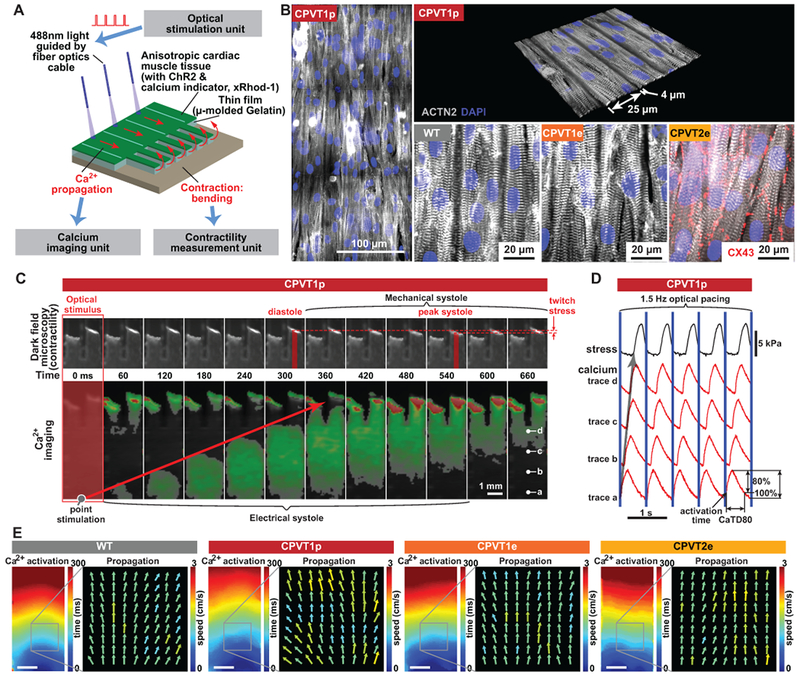
Figure 2. Opto-MTF engineered heart tissue for arrhythmia modeling.

A. Schematic of opto-MTF system to optically pace and optically measure tissue-level Ca2+ wave propagation and contraction. Cardiomyocytes programmed to express ChR2 are seeded on micro-molded gelatin with flexible cantilevers on one end. Focal illumination using optical fibers excites cells, resulting in Ca2+ wave propagation along the MTF and into the cantilevers. Ca2+ wave propagation is measured by fluorescent imaging of the Ca2+-sensitive dye X-Rhod-1, and mechanical contraction by darkfield imaging of the cantilevers. B. Confocal images of ACTN2-stained opto-MTFs. Micro-molded gelatin induces iPSC-CMs to grow with their long axis aligned with the long axis of the MTF. C. Excitation-contraction coupling in CPVT1p opto-MTFs. Representative time lapse images show Ca2+ wave propagation and mechanical systole recorded induced by optogenetic point stimulation. D. Ca2+ traces recorded at the points labeled a-d in the right-most image of panel C. Blue lines indicate optical pacing at the stimulation point. Activation time is the time to the maximal Ca2+ signal upstroke velocity. CaTD80 is the duration of the Ca2+ transient at 80% decay. E. Spatial maps of activation time and Ca2+ wave speed and direction for WT, CPVT1p, CPVT1e, CPVT2e opto-MTFs at 1.5 Hz pacing, demonstrating well-ordered tissue behavior under these conditions. Bar, 1 mm.
