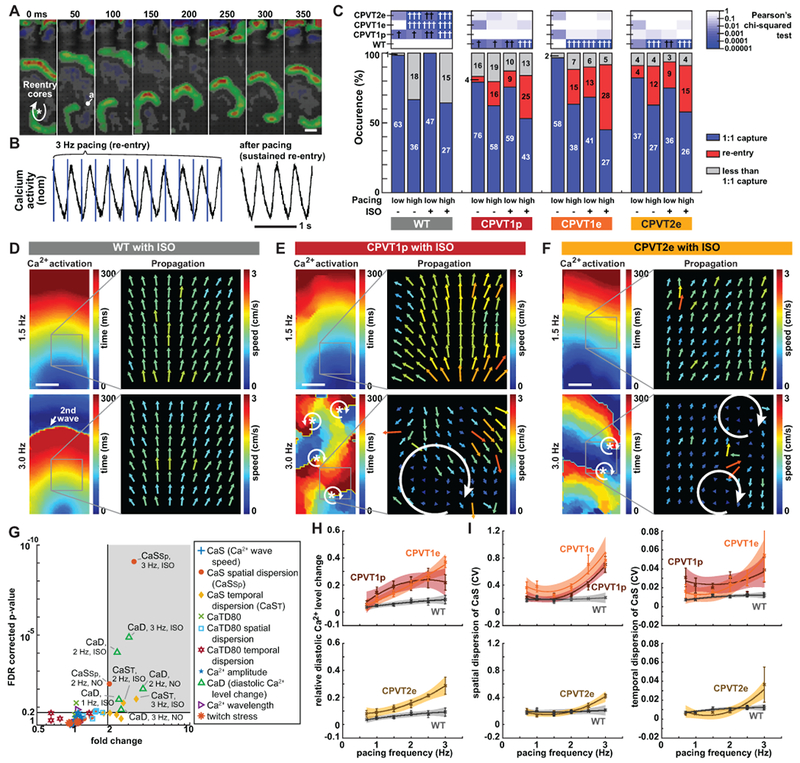
Figure 3. Characterization of CPVT opto-MTFs.

A. Time lapse images of CPVT1e opto-MTF Ca2+ wavefront propagation. Ca2+ wavefronts, calculated from the temporal derivative of Ca2+ signals, show spiral wave reentry. B. Representative Ca2+ signal traces during re-entry. Re-entrant Ca2+ signals were sustained even after pacing was discontinued. C. Occurrence of re-entry in CPVT and WT opto-MTFs. hi, ≥ 2 Hz pacing; lo, < 2 Hz pacing. High pacing rate and ISO increased re-entry occurrence. Pearson’s chi-squared test with same pacing and ISO conditions. The Bonferroni correction for multiple comparisons was applied for six possible pairwise tests performed with a corrected p threshold: †, P<0.05/6. ††, P<0.01/6. †††, P<0.001/6. Bars are labeled with sample numbers. D–F, Spatial maps of Ca2+ wave activation time and velocity in WT (D), CPVT1p (E), or CPVT2e (F) opto-MTFs. The same tissue is shown with 1.5 Hz or 3 Hz pacing. 3 Hz pacing and ISO increased spatiotemporal heterogeneity of CPVT tissues. G. Volcano plot shows 60 tissue-level parameters of Ca2+ propagation in WT vs. CPVT1p and CPVT1e opto-MTFs. Each of the ten markers represents the indicated property measured at three different pacing rates (1, 2, and 3 Hz) with and without ISO. Shaded region indicates parameters with FDR-adjusted P<0.20 and more than 2-fold change. H–I. Relative diastolic Ca2+ level change from basal condition (H) and spatial and temporal dispersion of Ca2+ wave propagation speed (I) as a function of pacing frequency, under ISO stimulation. Smooth lines are quadratic functions fit to the data. Shaded areas and error bars represent the 95% confidence interval for the fit and SEM, respectively. Data from tissues with 1:1 capture were included in G to I (n=12 WT, 33 CPVT1p, 13 CPVT1e, 15 CPVT2e from > 3 harvests). Bar in a, d, e, and f = 1 mm.
