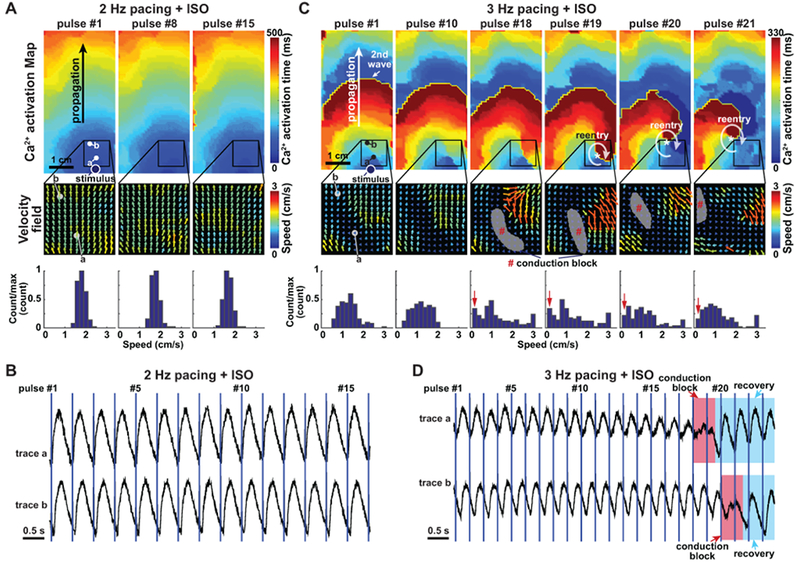
Figure 4. Initiation of re-entry in CPVT opto-MTFs.

A. CPVT1p opto-MTF at 2 Hz pacing with ISO. The Ca2+ activation map and velocity fields were well-ordered. Speed histogram reflects narrow range of values. B. Ca2+ tracings from points a and b in panel A. C. The same opto-MTF as in panel A, paced at 3 Hz with ISO. There is greater heterogeneity in the velocity field and disorganization of the Ca2+ activation map. Localized conduction block that permitted reentrant Ca2+ wave propagation become evident at pulse #18 and #19. Histograms indicate greater spatial dispersion of speed. D. Ca2+ tracings at points a and b in panel C. Red shading indicates conduction block overlying recording points, and blue shading indicates recovery from block.
