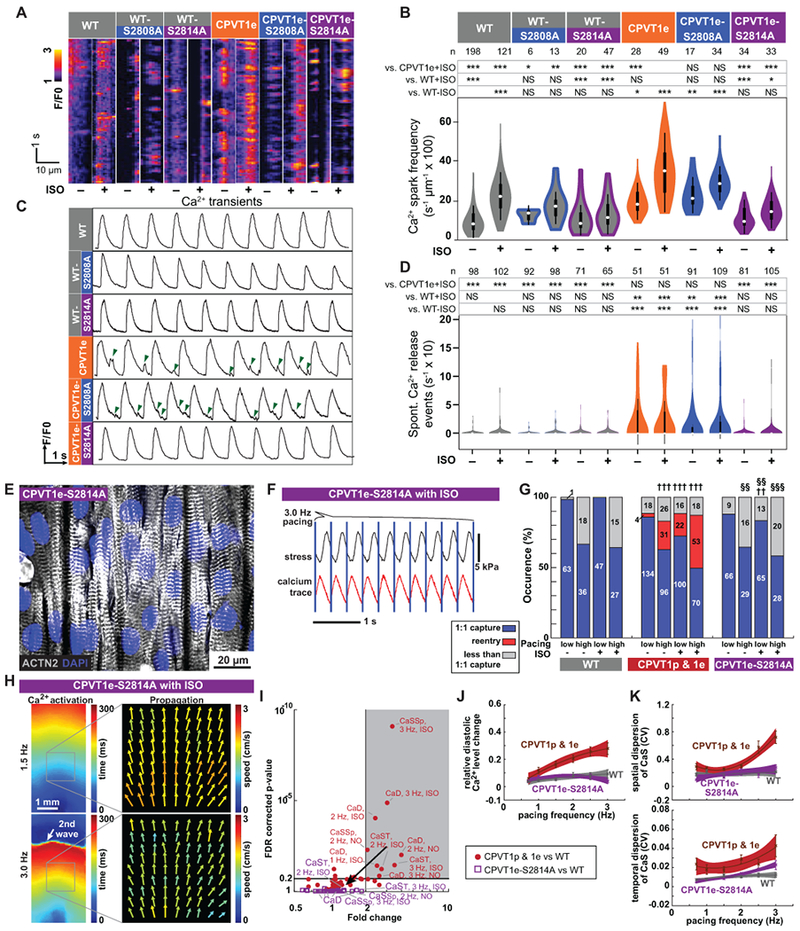
Figure 6. CaMKII phosphorylation of RYR2-S2814 is required to unmask the CPVT arrhythmic phenotype.

A–B. Incidence of Ca2+ sparks in quiescent iPSC-CMs in cell clusters. Representative traces (A). Quantitative analysis (B). WT and CPVT1e data are the same as in Figure 5B. Steel-Dwass non-parametric test with multiple testing correction: *, P<0.05; **, P<0.01; ***, P<0.001. NS, not significant. C–D. Incidence of spontaneous Ca2+ release events in spontaneously beating iPSC-CMs in cell clusters. Representative traces, (C). Green arrowheads indicate spontaneous Ca2+ release events. Quantitative analysis, (D). WT and CPVT1e data are the same as in Figure 1D. Statistics and symbols as in panel B. E. Confocal image of opto-MTF constructed using CPVT1e-S2814A iPSC-CMs. Myocytes are aligned by micro-molded gelatin substrate. F. Representative CPVT1e-S2814A opto-MTF. Ca2+ transients and systolic contraction were coupled 1:1 with 3 Hz optical stimuli (blue lines). G. Occurrence of re-entry in CPVT1e-S2814A compared to WT (††, †††) and CPVT1e (§§, §§§) opto-MTFs under matching conditions using Pearson’s chi-squared test. The Bonferroni correction for multiple comparisons was applied for three possible pairwise tests performed with a corrected p threshold: ††, §§, P<0.01/3. †††, §§§, P<0.001/3. Bars are labeled with sample numbers. H. Spatial maps of the same CPVT1e-S2814A opto-MTF paced at 1.5 Hz or 3.0 Hz, in the presence of ISO. Ca2+ activation time and Ca2+ wave propagation speed were well-organized and relatively homogeneous compared to CPVT1 (see Figure 3). I. Volcano plot of 60 tissue-level parameters of Ca2+ wave propagation (please see Figure 3). Unlike CPVT1 tissue parameters, CPVT1e-S2814A tissue parameters were not statistically different from those of WT. J–K. Relative diastolic Ca2+ level change from basal condition (J), and spatial and temporal dispersion of Ca2+ wave propagation speed (K) as a function of pacing frequency under ISO stimulation in CPVT1e-S2814A compared to CPVT and WT. Smooth lines are quadratic functions fit to the data; shaded areas and error bars show the 95% confidence interval for the fit and SEM, respectively. Only tissues responding 1:1 to every stimulus were included in i to k (n=12 WT, 33 CPVT1p, 13 CPVT1e, 15 CPVT2e, and 18 CPVT1e-S2814A from > 3 harvests).
