
Figure 2. a, b.
Histopathological images demonstrate the grade 1 (a) and grade 4 (b) ductus proliferation in the hepatectomized tissue samples. Panel A refers to the control group specimen, and B refers to the DX group specimen (H&E, ×20)
Official websites use .gov
A
.gov website belongs to an official
government organization in the United States.
Secure .gov websites use HTTPS
A lock (
) or https:// means you've safely
connected to the .gov website. Share sensitive
information only on official, secure websites.
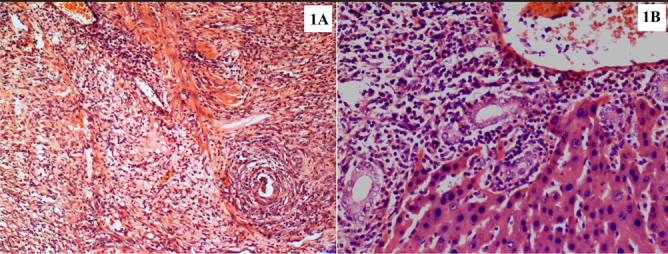
Histopathological images demonstrate the grade 1 (a) and grade 4 (b) ductus proliferation in the hepatectomized tissue samples. Panel A refers to the control group specimen, and B refers to the DX group specimen (H&E, ×20)