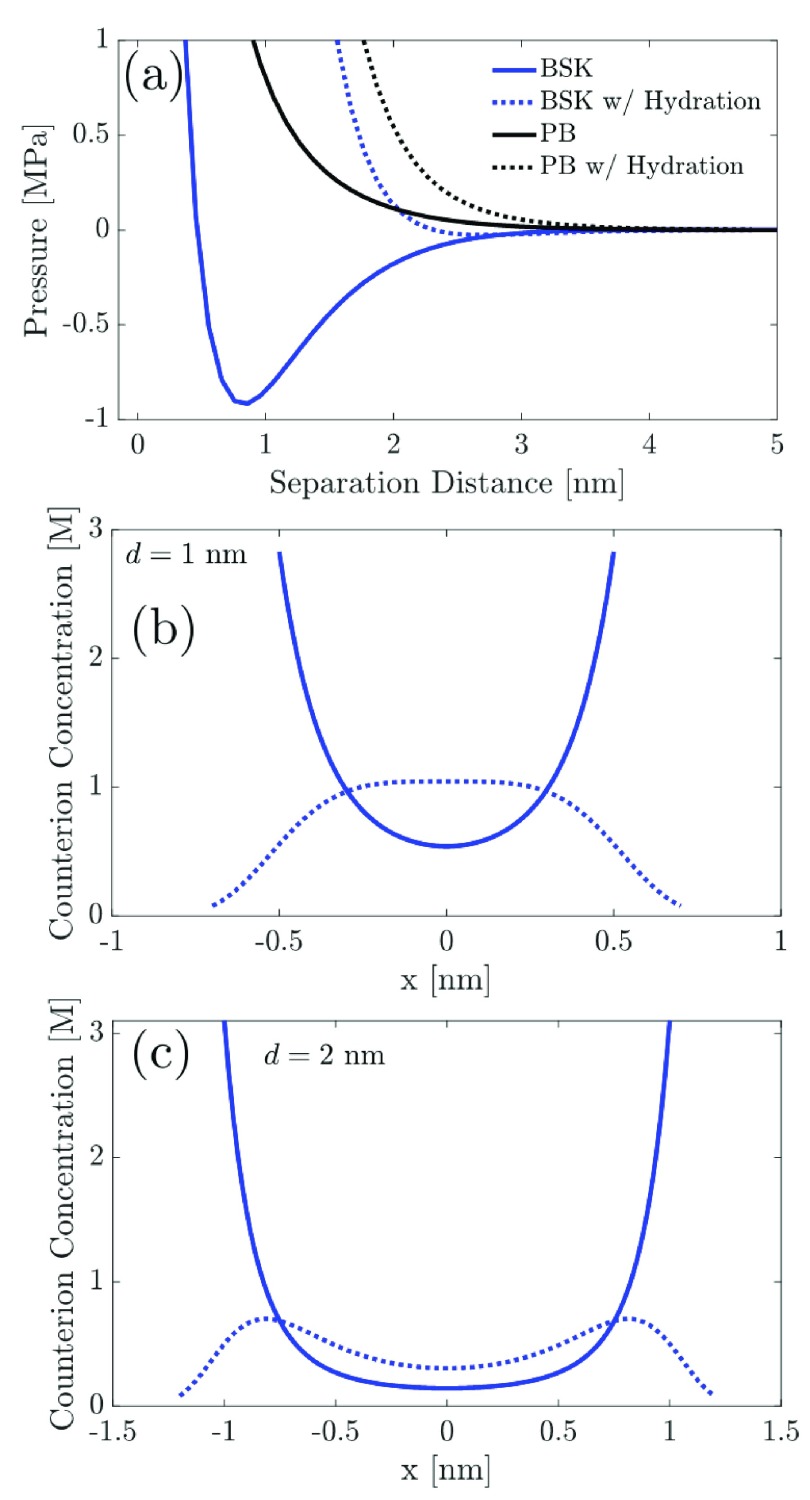
Figure 6.
(a) Variation of the disjoining pressure with the separation distance between two similarly charged surfaces for a 2:1 electrolyte solution, predicted by the BSK and the PB models with inclusion/exclusion of the hydration potential. Note that the parameters used to generate these results include: qs = −0.1 C/m2, c0 = 0.1 M, ϵr = 80, σh = 5/nm2 (from ref (63)), κh–1 = 0.3 nm (from ref (63)), and lh = 0.2 nm. The parameters for the hydration potential (σh, κh–1, and lh) can be further fine-tuned to reproduce the experimental data. (b) Comparison of the counterion profiles predicted using the BSK model without hydration and the BSK model with hydration, for d = 1 nm, as a function of x, where x is the spatial coordinate perpendicular to the plane of the charged surface. (c) Same as (b), but for a separation distance of 2 nm between the two charged surfaces.

