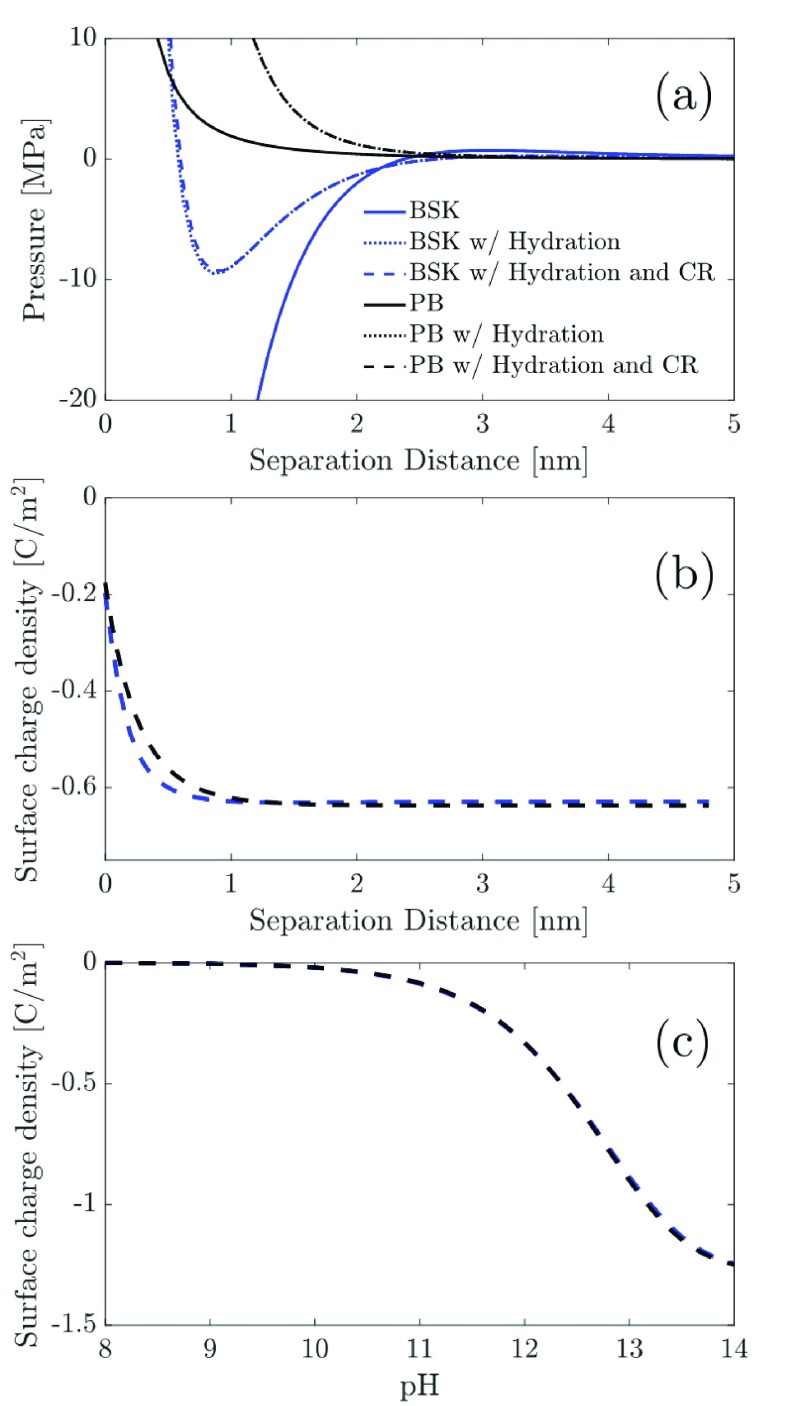
Figure 7.
(a) Disjoining pressure vs the surface separation distance profiles predicted by the BSK model without hydration, the BSK model with hydration, and the BSK model with hydration and with CR are compared with those predicted by the PB model without hydration, the PB model with hydration, and the PB model with hydration and with CR. The parameters used to generate the results shown here are: c0 = 19.1 mM, ϵr = 80, κh–1 = 0.3 nm, σh = 5/nm2, lh = 0.2 nm, Γ = 1 × 10¹⁸ m–2, and pKb = 4. Note that when CR is neglected, we used qs = −0.63 C/m2. (b) Surface charge density vs the surface separation distance profiles predicted using the BSK model with hydration and CR (blue dotted line) and the PB model with hydration and CR (black dotted line). Note that the parameters: c0, ϵr, κh–1, σh, lh, Γ, and pKb are the same as those used in (a), and that due to the incorporation of CR, qs varies with the separation distance between the two charged surfaces. (c) Surface charge density vs the solution pH profiles predicted using the BSK model with hydration and CR (blue dotted line) and the PB model with hydration and CR (black dotted line) for a separation distance of 4 nm between the two charged surfaces. Note that both surfaces are assumed to be negatively charged and to possess identical surface charge densities. Furthermore, the parameters used to generate the surface charge density profiles are the same as those used in (b).

