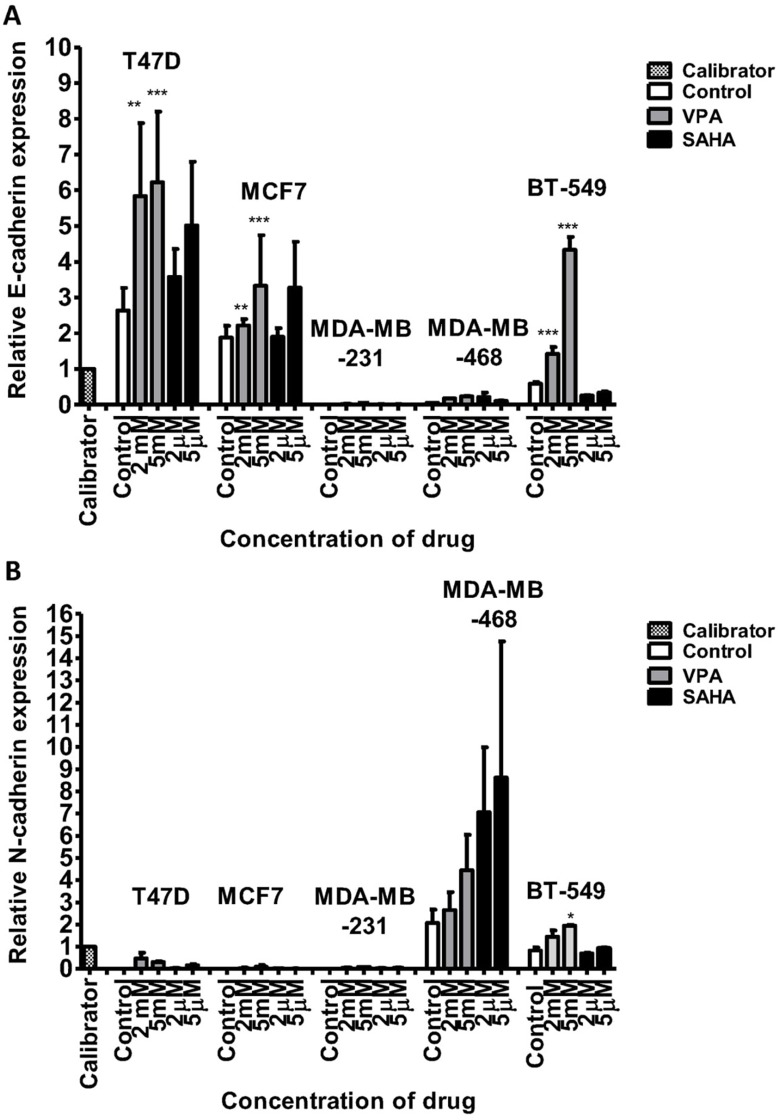
Figure 4.
mRNA expression of CDH1 (E-cadherin) and CDH2 (N-cadherin) in breast cancer cell lines after VPA or SAHA treatment.
Notes: Expression of CDH1 (A) and CDH2 (B) was analyzed by qPCR in T47D, MCF7, MDA-MB-231, MDA-MB-468 and BT-549 cells exposed to either culture medium alone (control) and VPA (2 mM, 5 mM) or SAHA (2 µM, 5µM) for 24 hrs. The differences between groups were evaluated using the one-way ANOVA; Tukey’s post-hoc test. p<0.05 was considered to indicate a statistically significant difference. Results were presented as mean ± SD.
Abbreviations: SAHA, vorinostat; VPA, valproic acid.

