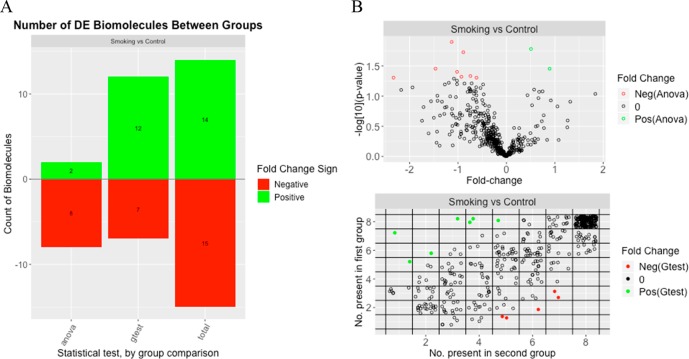
Figure 3.
Graphical summary of the statistical results that includes (A) a bar graph of the number of significant proteins, both in total and broken out by statistical test, and (B) a volcano plot for the t-test (ANOVA) results (top) and a plot of the number of observations per group for the g-test results (bottom).

