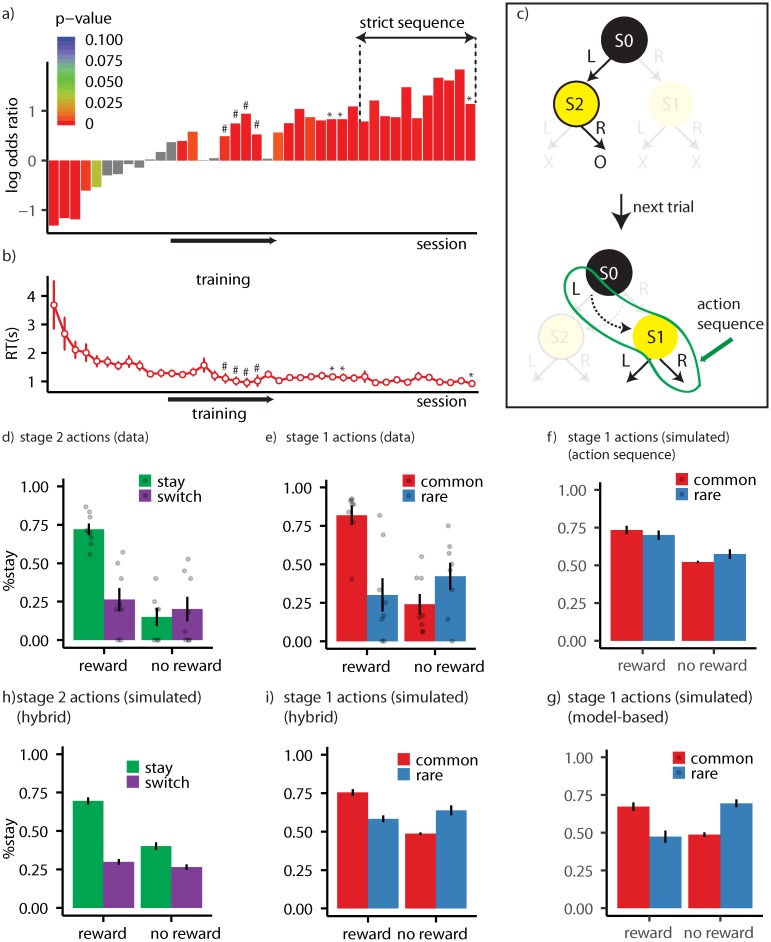
Fig 3.
(a) Logarithm of odds ratio of staying on the same stage 1 action after getting rewarded on the previous trial over the odds ratio after not getting rewarded. The zero point on the y-axis represents the indifference point (equal probability of staying on the same stage 1 action after reward or no reward). Each bar represents the odds ratio for a single training session. In the sessions marked with ‘#’ in Figure 3a the contingency between stage 1 actions and stage 2 states were revered (‘L’ leads to S1 and ‘R’ to S2). ‘Strict sequence’ refers to sessions in which a trial was aborted if the animal entered the magazine between stage 1 and stage 2 actions. Sessions marked with ‘*’ are probe sessions in which the task involved both rare and common transitions. (b) Reaction times (RT) averaged over subjects. RT refers to the delay between performing the stage 1 and stage 2 actions. Each dot represents a training session. (c) An example of how the performance of action sequences can be detected in the probe session. On a certain trial a rat has earned a reward by taking ‘L’ at stage 1 and ‘R’ at stage 2. The subject then repeats the whole action sequence (‘L’ and then ‘R’), even though after executing ‘L’ it ends up in S1 (due to a rare transition) and action ‘R’ is never rewarded in that state. (d) The probability of staying on the same stage 2 action in the probe session averaged over subjects, as a function of whether the previous trial was rewarded (reward/no reward) and whether subjects stayed on the same stage 1 action (stay/switch). As shown in panel (c) only the trials in which state 2 state is different from the previous trial are included. (e) The probability of staying on the same stage 1 action in the probe session averaged over subjects as a function of whether the previous trial was rewarded (reward/no reward) and whether the transition in the previous trial was common or rare. (f) Model simulations depicting the probability of staying on the same stage 1 action when the model is using exclusively action sequences. (g) Model simulations depicting the probability of staying on the same stage 1 action when the model is using the true state-space of the task but not action sequences. (h) Simulation of stage 2 choices, and (i) stage 1 choices using the best-fitted parameters for each subject. Error bars represent ±1 SEM.

