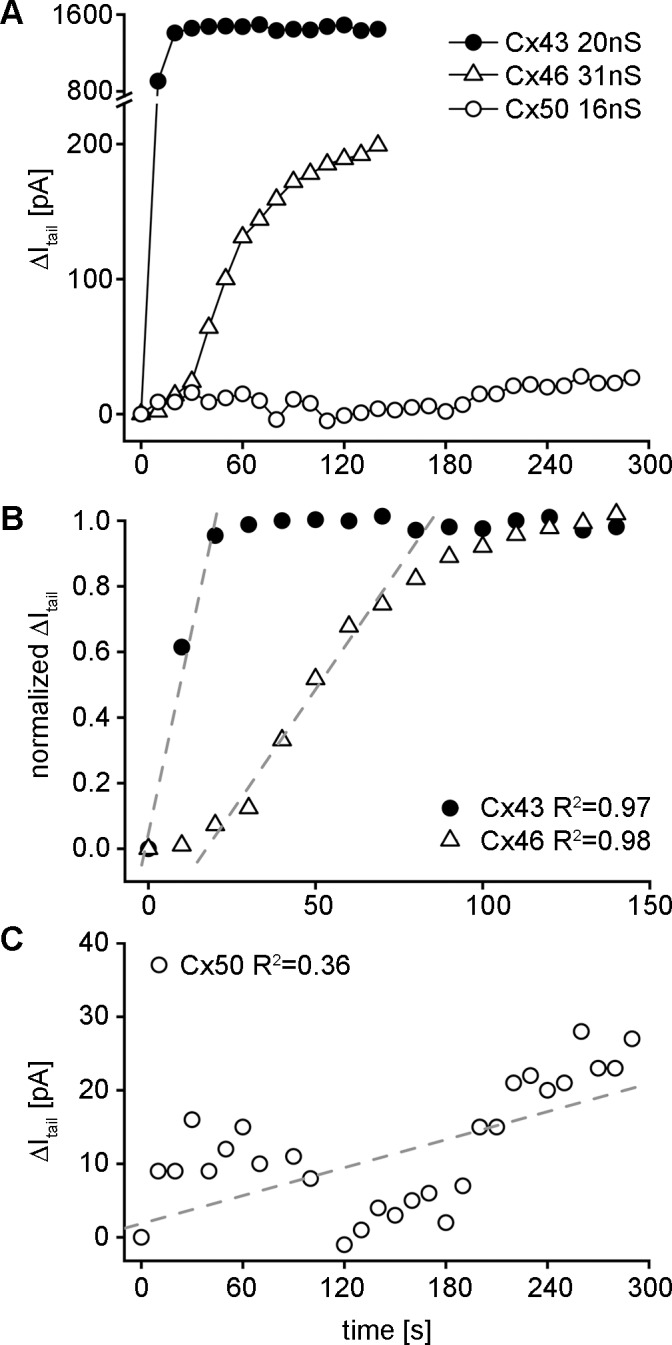
Figure 3.

Quantitative comparison of intercellular cAMP transfer between the different lens connexins. (A) The change in the SpIH tail current was plotted versus time for individual cell pairs expressing Cx43 (filled circles), Cx46 (open triangles), or Cx50 (open circles). (B) A plot of the normalized tail current versus time recorded from the recipient cell after cAMP injection into the source cell for the Cx43 and Cx46 expressing cell pair. The SpIH activation time corresponds to the time when SpIH current reaches saturation in the recipient cell. The slopes of first order regressions over the linear part of the plot (dashed lines) were used to calculate the current activation rate (ΔI/Δt). (C) Expanded view of the SpIH tail current data for the Cx50 cell pair shown in (A). In the Cx50 cell pairs where the SpIH current increased, it never reached saturation during the finite period that cells could be recorded from, so ΔI/Δt was estimated from fitting the current increase over the entire range of data available.
