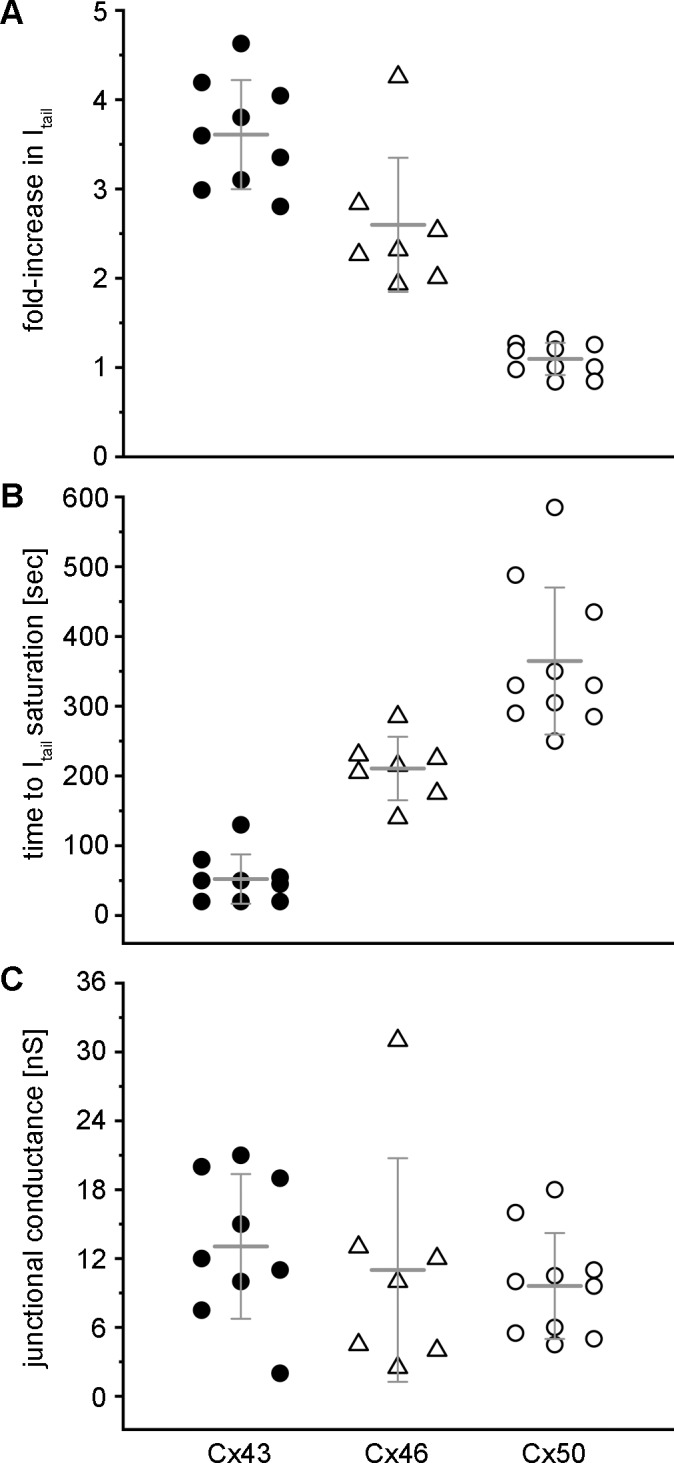
Figure 4.

Summary quantification of SpIH current and gap junction conductance data. (A) The fold-increase in the SpIH tail current after cAMP delivery to the neighboring cell was plotted for individual cell pairs expressing Cx43 (filled circles, n = 9), Cx46 (open triangles, n = 7), or Cx50 (open circles, n = 10). Mean values of the data are plotted as horizontal lines, with standard deviations plotted as vertical error bars. (B) Plots of the time required for the SpIH tail current to reach saturation in Cx43 and Cx46 cell pairs. For Cx50, the time elapsed without the SpIH tail current reaching saturation was plotted. (C) Plots of the total gap junctional conductance measured between cell pairs expressing Cx43, Cx46, or Cx50.
