Figure 7.
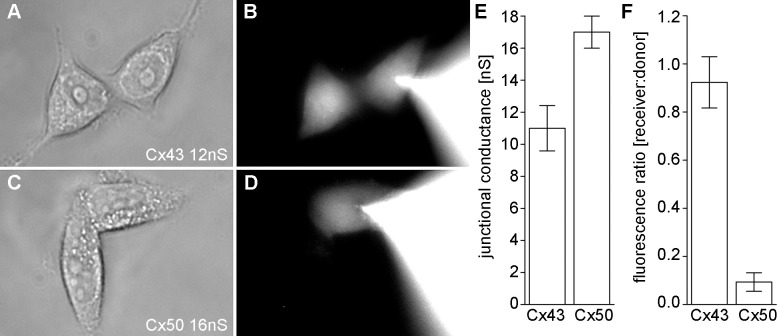
Quantitative comparison of ε-cAMP flux through Cx43 and Cx50 channels. Simultaneous measurements of gap junction conductance and ε-cAMP flux were made in cell pairs. (A) In a Cx43 expressing cell pair with conductance of 12 nS, (B) high levels of ε-cAMP fluorescence were recorded in the recipient cell 5 minutes after the patch pipette was opened in the donor cell. (C) In a cell pair expressing Cx50 with a conductance of 16 nS, (D) very little passage of ε-cAMP into the recipient cell was seen after 5 minutes. (E) The mean (±SD) conductance for all tested Cx43 and Cx50 cell pairs (n = 3). (F) The ratio of ε-cAMP fluorescent intensity in the recipient cell compared with the donor cell for Cx43 and Cx50.

