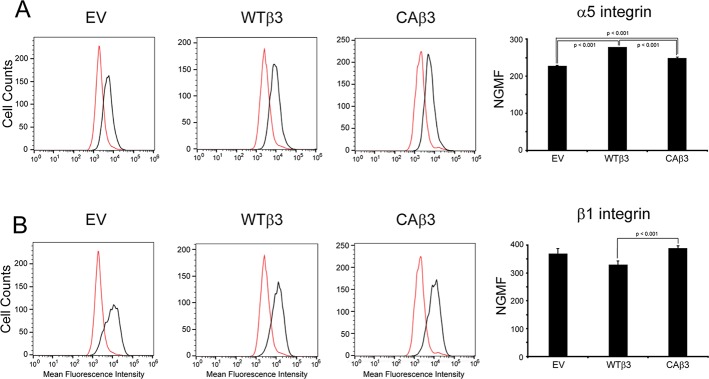
Figure 3.
α5 and β1 integrin levels in EV, WTβ3, and CAβ3 cell lines. FACS analysis was performed on EV, WTβ3, and CAβ3 cells using (A) mAb PD16 (black) against the α5 integrin subunit or (B) mAb 12G10 (black) against the β1 integrin subunit. For both profiles, mouse IgG (red) was used as a control. Representative FACS profiles for each cell line are shown for each antibody. Each profile is from one analysis using duplicate determinations. The normalized geometric mean fluorescence (NGMF) for each antibody was determined by pooling data from two analyses, both using duplicate determinations (n = 4). The three cell lines demonstrated minor, statistically significant differences in α5 integrin levels (all P < 0.001) that did not correlate with differences in fibronectin fibril assembly. A minor, statistically significant difference (P < 0.04) between β1 integrin levels in WTβ3 and CAβ3 cells was also found; however, no difference was found in β1 integrin levels when EV and CAβ3 cells were compared. NGMF results represent the mean ± SE.

