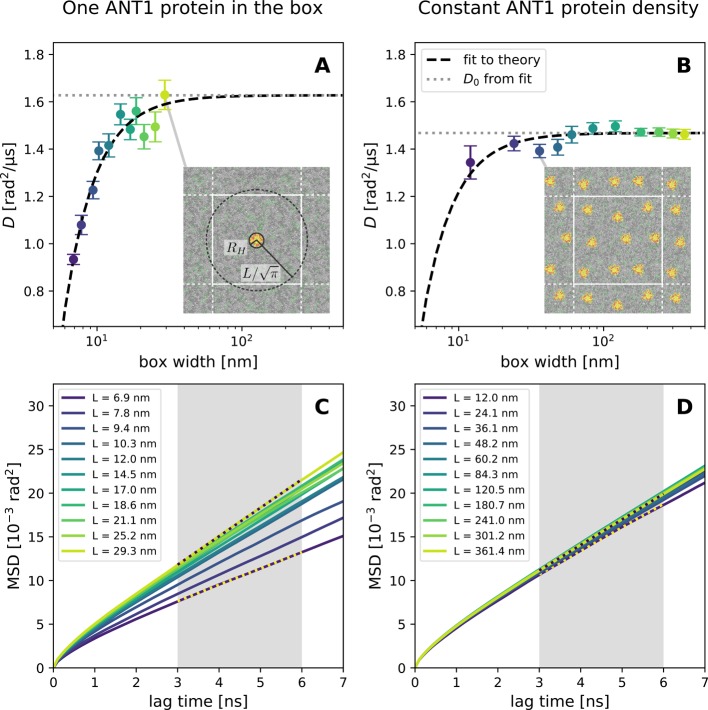
Figure 3.
Rotational diffusion of ANT1 proteins in lipid membranes. (A) Diffusion coefficients from MD simulations of systems containing one protein per simulation box (symbols) with fit (dashed line) to hydrodynamic theory (eq 15) and the infinite-system value D0 (dotted line) obtained from this fit. The inset shows a top view on the system at L = 29.3 nm with the cylindrical approximations of the protein and simulation box. (B) Diffusion coefficients from MD simulations of systems containing ANT1 proteins at a constant area density with the corresponding fit. The inset shows a top view on the system at L = 36.1 nm. Error bars denote 1 SE. (C, D) MSD curves corresponding to (A) and (B), respectively. Gray regions indicate the fitting range.

