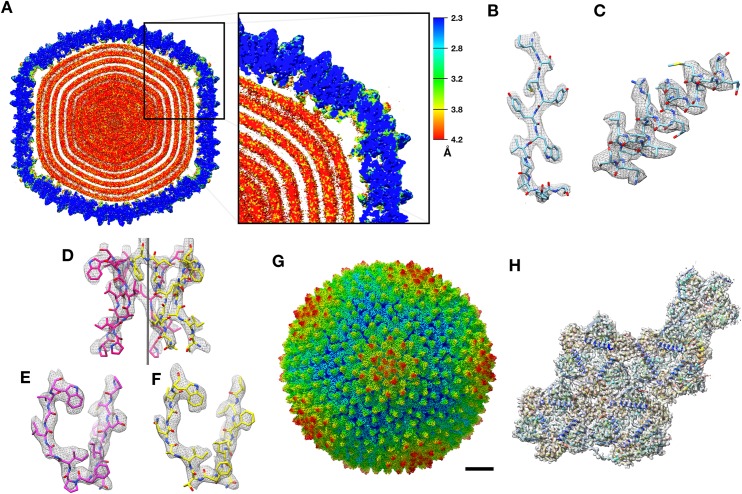
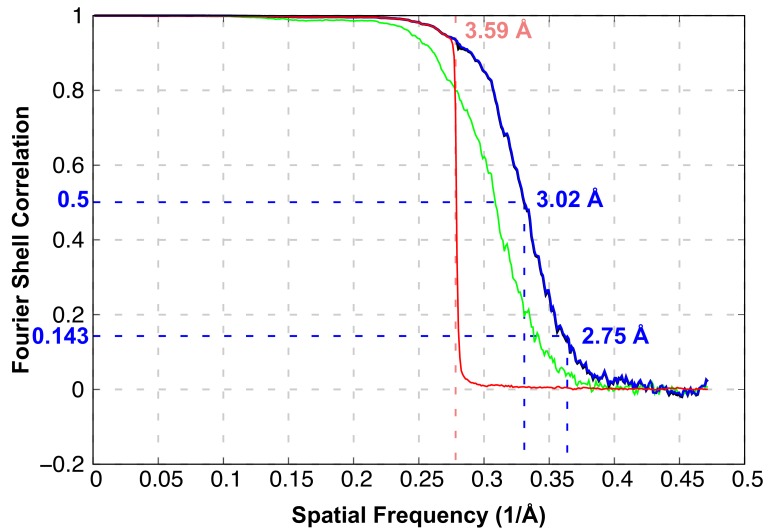
Figure 1. CryoEM structure of PR772 and resolution estimates.
(A) The local resolution estimate of the CryoEM map from ResMap. The map shows the distribution of resolution in different regions. (Visualized using USCF Chimera, with volume viewer parameters: Style surface, step 1 and level 0.037, Plane 418, Axis Y, Depth 23). Most of the capsid that was used for model building is resolved at 2.3 Å. (B, C and D) Show the quality of the map in different regions. (B) Quality of the map at the core of the capsid protein P3 (Chain B, residues 162–173) where the local resolution estimate is 2.3 Å. (C) Quality of the map close to the membrane (P3 Chain B, residues 18–35) where the resolution is estimated to 3.2 Å. (D) Quality of the map close to the five-fold vertex of the icosahedral viral particle. The black vertical line represents the five-fold axis. (E and F) The initial model fit of P5 residues 108-121(in pink) and P31 residues 113–126 (in yellow) to the same region of the map using Phenix: Find helix and sheets with respective protein sequences as input. (G) The post processed map of PR772 and the scale bar represents 10 nm. (H) The map:model fit of the asymmetric unit as seen from the inside of the viral particle.


