. 2019 Sep 12;8:e48496. doi: 10.7554/eLife.48496

Figure 2. Major capsid protein P3 and its conformations.

(A) (visualized from the outside of the viral particle) The four unique P3 trimers (represented in four different colors) and their arrangement forming the trisymmetron bound by the P30 dimers (in gray). The C-terminal region and the N-terminal region of P3 subunits are colored in red and blue respectively. The highlighted regions show the locking of P30 (in black) by the C-terminal region of the neighboring P3 subunits, leading to the formation of a hinge-like mechanism which is not seen in PRD1. (B) Schematic representation of the P3 trimers and the subunit arrangement to form a hexagonal capsomer (as viewed from outside) and (C), (D), (E,) (F) are aligned to this view. (G) It is the orthogonal view to the schematic (B) and (H), (I), (J), (K) are aligned to this view. Different views of trimer 1 (C,H), trimer 2 (D,I), trimer 3 (E,J) and trimer 4 (F,K) show the variation in the N-terminal (shown as blue cylinders with the arrow heads pointing towards the C-terminal) and C-terminal (shown as red planks with the arrow heads pointing towards the C-terminal) region of P3 subunits. N and C termini are shown as spheres with respective colors. They are colored to match (A). The yellow pentagons are a schematic representation of the penton.

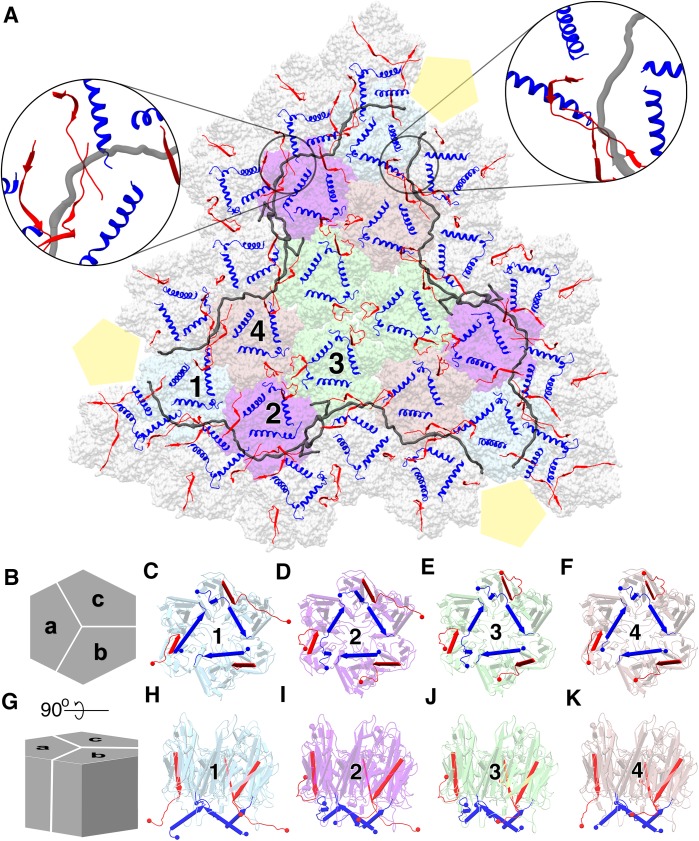
Figure 2.

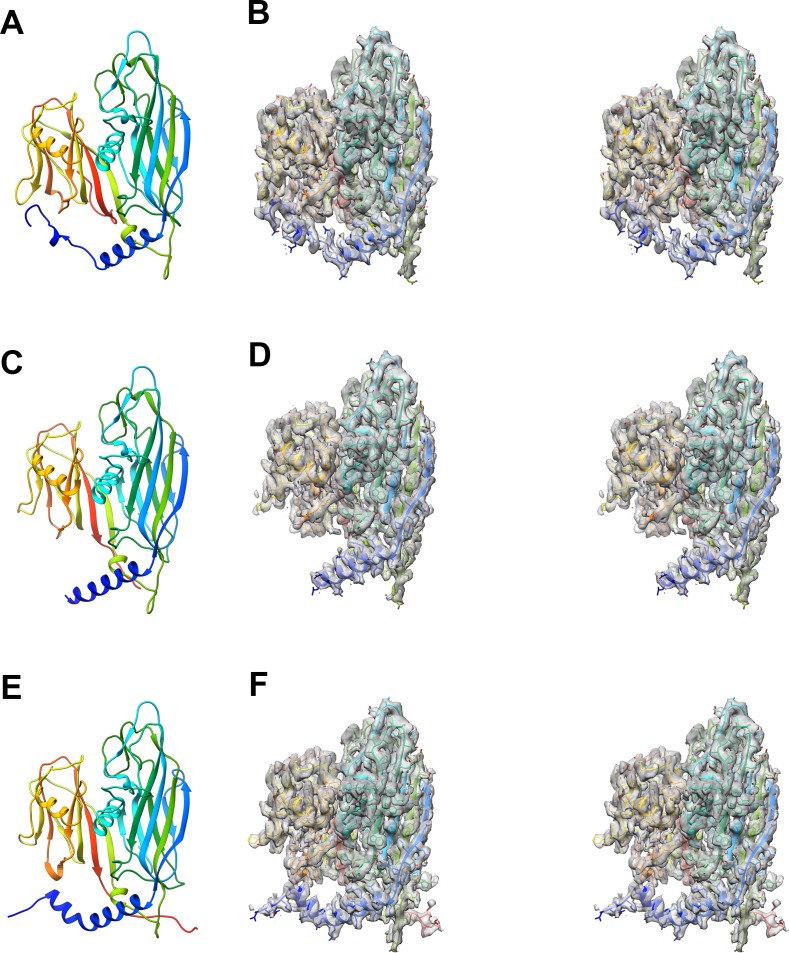
Figure 2—figure supplement 1. Shows the different N-terminal conformations of the P3 monomer.

Figure 2—figure supplement 1.

(A, C and E) represents the model of subunits a, b and c respectively of the trimer labeled two in Figure 2. (B, D and F) represents the stereo images of the model of subunit a, b and c fit into their respective CryoEM maps. The N-terminal conformations of P3 in (A, C and E) represent the helix turn helix, the long helix and the long helix with a kink respectively.
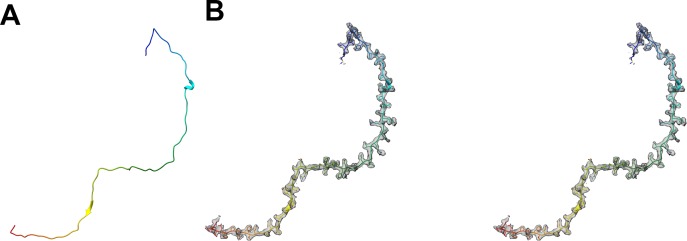
Figure 2—figure supplement 2. Modelled P30 protein and its map density fit.

Figure 2—figure supplement 2.

(A) The model of the tape-like protein, P30. (B) The stereo images of the model fitted into the CryoEM map.
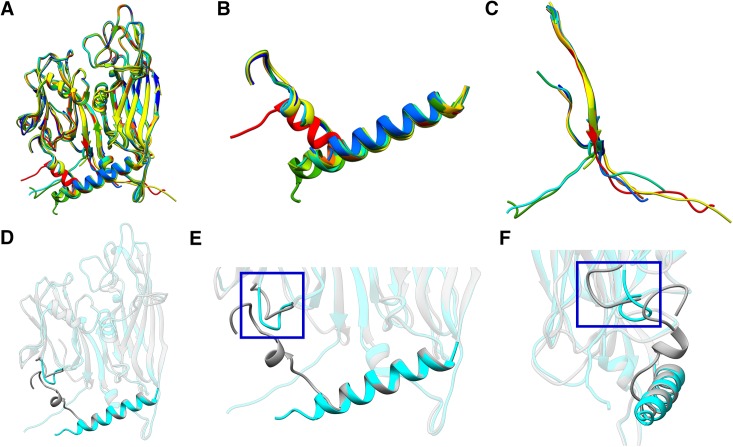
Figure 2—figure supplement 3. Variations in the P3 subunits.

Figure 2—figure supplement 3.

(A) Shows the superposition of twelve P3 subunits that form the asymmetric unit. (B) Shows all the N-terminal regions of P3, isolated from (A). (C) Shows all the C-terminal regions of P3, isolated from (A). (B) and (C) shows the structural variability in the C and N-terminal regions of P3. (D, E and F) Shows the superposition of two P3 subunits, one with helix turn helix conformation of the N-terminal regions of P3 (gray) and the other with a long helical conformation of the N-terminal region of P3 (cyan). (E) and (F) highlight the loop formed by Tyr351-Val358 residues. Here, the P3 subunit with helix turn helix conformation of the N-terminal regions (gray) shows that the loop formed by Tyr351-Val358 residues is flipped compared to the loop in the P3 subunit with a long helical conformation of the N-terminal regions (cyan).